

In this deep dive, I look at the recent results of Absa (JSE: ABG) and Standard Bank (JSE: SBK). There’s much to learn from these financial services giants, but there’s one clear theme that came through for me: while Africa may tell a great story in a slide deck, the South African businesses are still doing the heavy lifting.
Absa’s results presentation uses a map of Africa on the cover page. Standard Bank’s tagline in the report is “Africa is our home, we drive her growth”. Yet both groups generated more earnings in South Africa than on the rest of the continent combined!
Africa is an important source of growth and diversification. It can also be a highly lucrative place to do business, evidenced by Absa’s net interest margin of 735 basis points in Africa Regions vs. 378 basis points in South Africa.
Just don’t underestimate South Africa as the anchor market for these groups. Local is firmly still lekker.
Standard Bank is much bigger than Absa – and generates higher ROE
Absa operates across 17 countries on the continent and has 13.4 million customers. That’s impressive, but Standard Bank is the largest financial services group in Africa, operating across 21 countries and with 20 million active customers.
Scale matters in this game, as it drives efficiency and diversifies risk. Case in point: Standard Bank has now achieved 10 consecutive six-month periods of positive jaws, while Absa is guiding for negative jaws for the full year.

This scale difference can be observed in Return on Equity (ROE), a key valuation metric for a bank. Absa’s ROE improved from 14.8% to 15.0% in its interim period. This 20 basis points improvement looks solid until you compare it to Standard Bank’s increase from 19.1% to 19.8%.
These are structurally different ROEs, which helps explain why Absa and Standard Bank also trade at such different valuations.
Understanding the SA vs. Africa story
Absa’s stated ambition is “to be a leading pan-African bank”, so they think far more broadly than the original acronym would imply. In case you’re wondering, Absa dropped the underlying Amalgamated Banks of South Africa all the way back in 1997. That’s your trivia out of the way for the week!
The problem is that the Africa Regions segment at Absa didn’t grow in the interim period. Revenue fell by 3% and headline earnings was down by a nasty 10%. Conversely, South Africa grew revenue by 8% and headline earnings by 17%.
The South African contribution to Absa’s group headline earnings increased from 66.0% to 71.7%. Kenya and Ghana contributed a combined 11.5%, with the remaining markets contributing 16.8%.
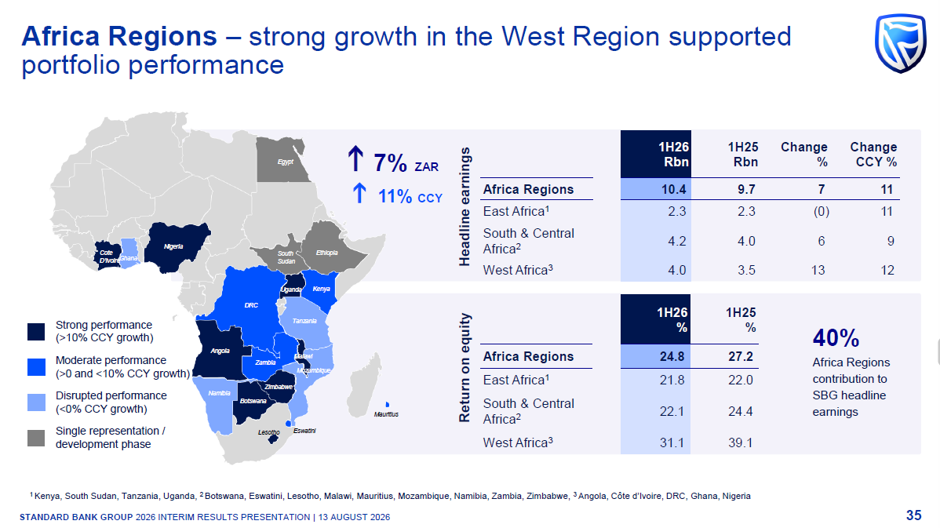
Over at Standard Bank, SBSA (the local business) grew headline earnings by 14%, roughly double the 7% achieved by the Africa Regions. SBSA contributed 51% of group headline earnings vs. 40% in Africa and the remaining 9% in the offshore and ICBCS operations.
Kudos to Standard Bank for this lovely slide showing the pockets of growth in the latest period in Africa:
Unpacking the credit performance
Absa’s revenue increased by just 4% for the period, yet HEPS was up by 8%. This is thanks to a 1% decrease in impairments, with this slide doing a great job of showing how a credit loss ratio tends to go through cycles, with the through-the-cycle target range held steady (thereby doing what it says on the tin):
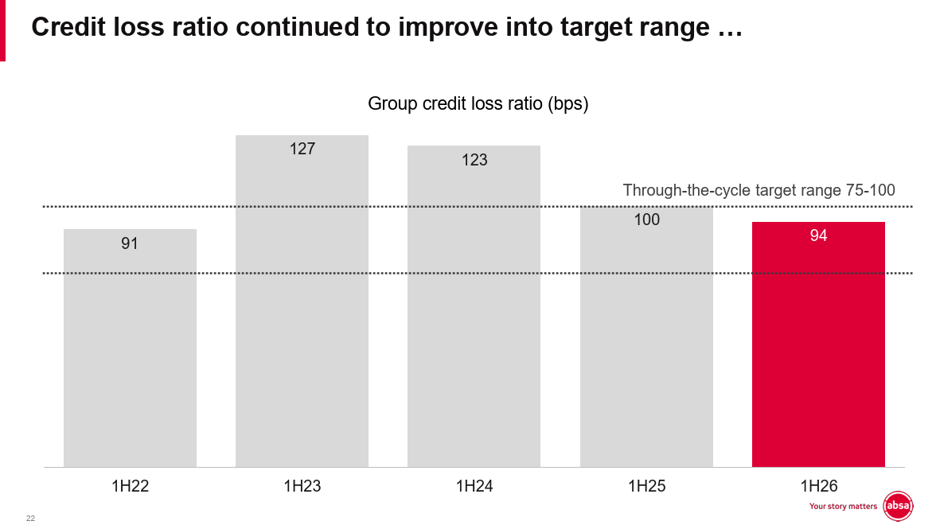
As you can see, the latest period saw an improvement in this ratio from 100 basis points to 94 basis points.
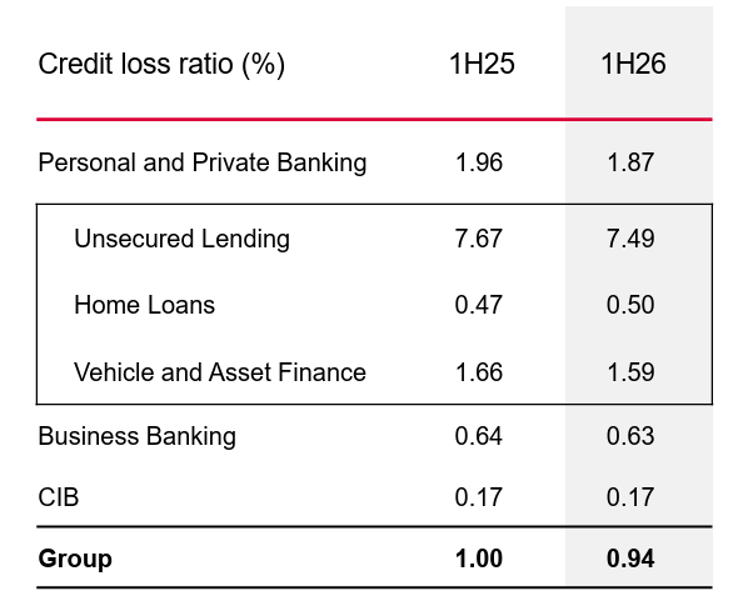
That may come as a surprise, especially given the macroeconomic backdrop to these numbers. Something else that you may not have seen before is the enormous difference in credit losses between unsecured lending (like personal loans) and secured lending (vehicle finance and home loans). If you’ve ever wondered why personal loans have to be priced so high, here’s your answer:
Over at Standard Bank, group headline earnings grew by 10% despite total income only growing by 5%. In this case, the improvement in impairments was even more extreme: it fell by 12%, giving banking earnings quite the boost.
This was driven by a decrease in the credit loss ratio across the four major lending businesses in the personal banking side of SBSA, driving an improvement in the group credit loss ratio from 93 basis points to 73 basis points:
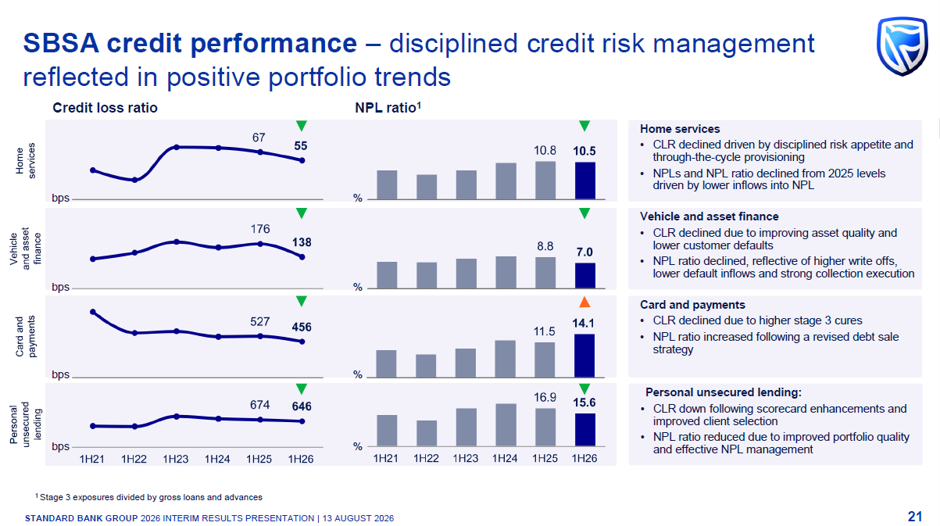
Both banks are telling a better impairments story than before, but Standard Bank has enjoyed the biggest positive move. The credit loss ratio at Standard Bank is also considerably lower than at Absa.
Business banking: a critical market
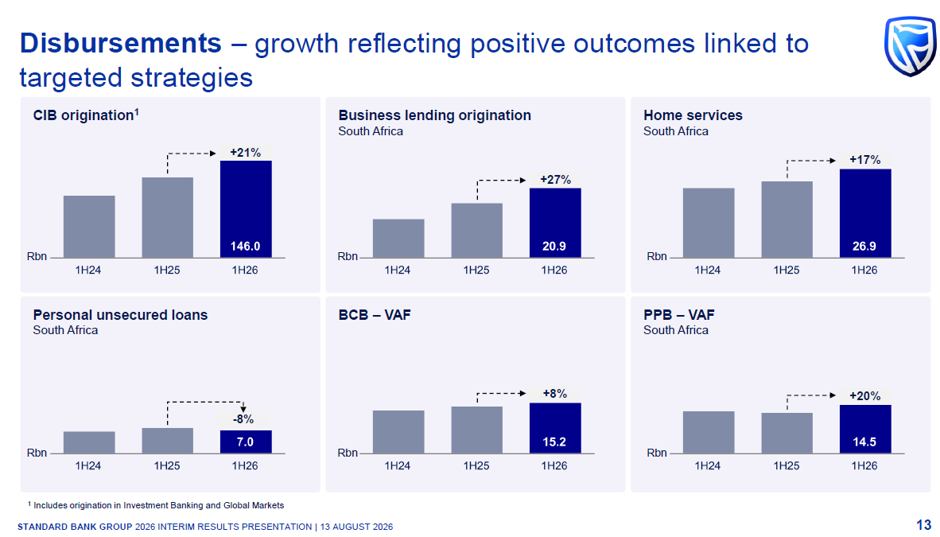
There are many different products offered by these banks. They also focus on different things at different times. At Standard Bank for example, there’s been a clear tilt in disbursements away from unsecured loans and towards corporate and business banking activities, as well as home and vehicle asset finance:
But the thing that surprised me most in this deep dive was just how lucrative the business banking operations are at both banks.
At Absa, this segment offers the best ROE in the group (up from 23.1% to 24.6%). It grew earnings by 5%, well ahead of the 1% growth in Corporate and Investment Banking for example.
The Business and Commercial Banking segment at Standard Bank is even stronger, boasting a 36.3% ROE. It’s under pressure though, with ROE down from 37.5% in the prior year due to a decline in headline earnings of 2%.
It’s little wonder that Capitec (JSE: CPI) is aggressively expanding into this space! Any market share lost by the legacy banks to Capitec will hurt their ROE.
Insurance as a driver of returns
The bancassurance model is designed to drive higher ROE through generating insurance profits from banking clients. Standard Bank seems to be doing a much better job of it at the moment.
Absa suffered a 2% decline in headline earnings in the insurance segment of the personal banking business. It barely gets a mention in the earnings presentation.
Conversely, insurance and asset management is a distinct segment at Standard Bank. It’s not a perfect comparison to the Absa numbers, but that’s also the whole point – Standard Bank is giving it far more focus. The blue bank enjoyed headline earnings growth of 15% in this segment!
This was helped along by the short-term underwriting margin coming in at an excellent 17% vs. the target of 10%. Also don’t underestimate the asset management business at Standard Bank, with assets under management and administration up 23% in Africa Regions and 13% in South Africa.
ROE in this segment at Standard Bank was 19.7%, ahead of the personal banking business at 19.2%. It’s also a lot higher than Absa’s group ROE, so this is an area where Absa could look to compete more effectively.
Watch those jaws
The concept of jaws in banking is interesting. It measures the difference in growth rate between income and expenses. Simply put, a negative jaws scenario arises where expense growth is outpacing income growth, leading to a decline in margins.
Absa has guided only low- to mid-single digit revenue growth for the full year. In an inflationary environment, that puts the group at risk of “slightly negative jaws” according to the guidance. Staff costs (up 6%) will need to be closely watched here, as this line contributed 58% of total costs in the interim period. Technology also needs to be carefully managed, with growth of 6%.
Spare a thought for those earning advertising revenue from Absa. Marketing costs fell by 9% to just over R1 billion. Absa can’t just rely on an improving credit loss ratio to keep boosting earnings, so perhaps they need to invest more aggressively in growing the brand and the business?
At Standard Bank, staff costs were 59% of total costs and grew 6% – a remarkably similar performance to Absa. Software, cloud and tech spend increased by 6%, so that’s also well in line with what we are seeing at Absa. The difference is in revenue, with Standard Bank maintaining guidance of mid- to high-single digit revenue growth.
That’s enough for positive jaws for the full year and for ROE to grow vs. 2025 (based on guidance).
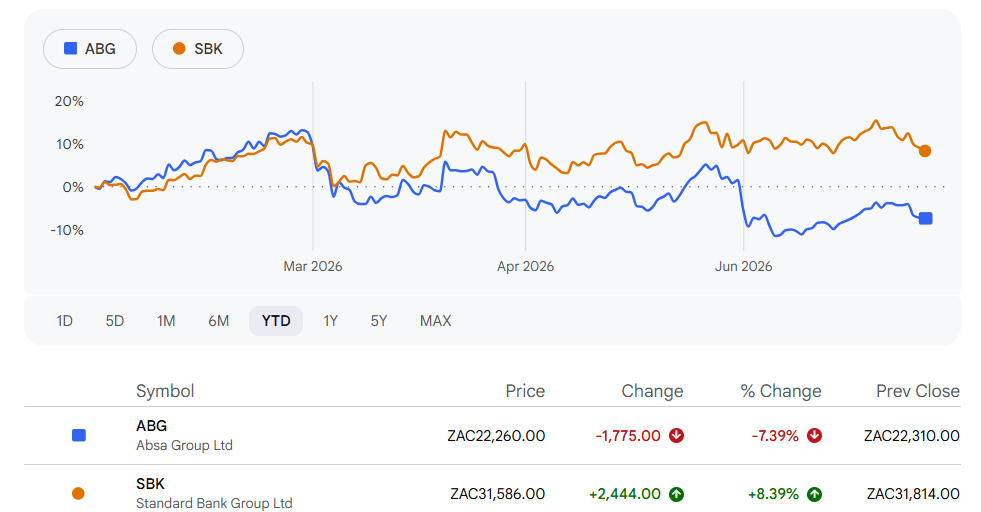
It’s also enough for Standard Bank to be outperforming Absa on a year-to-date basis, with the market choosing to back the scale player in Africa:
They may both be legacy banks, but there are many interesting differences once you start to unpack them.


It would be interesting to see the same analysis for Nedbank
Kudos for an excellent analysis. I am sure the CEOs of the banks will appreciate the comments and will have a deeper understanding of their business
Great insight, Ghost! Fascinating how value-accretive is the business banking space. Also encouraging if you view it as a basic barometer for the overall economy and business activity.
👍🏻 GREAT article! 👏🏻
Very informative & insightful.
An insightful article. South African operations for banks and insurance firms based in RSA are likely to do the heavy lifting well into the future as the markets in the rest of continent continue to evolve. However, there is a compelling reason to establish yourself there not only for diversification purposes but more importantly for the growth potential. There is no doubt that sometime in the future, no one knows when, Africa will power global economic growth.