
In this piece, I’ll be dealing with the latest results from BHP (JSE: BHG) – the largest mining company in the world with a market cap of R3.7 trillion – and DRDGOLD (JSE: DRD), a gold tailings company with a market cap of just R39 billion. Yes, that’s just over 1% the size of BHP. When we say mining giants, we mean it.
A sector of many different strategies
The mining sector is the bedrock of the South African economy. But as we know, it’s been through some tough times over the years. Famous local mining houses have responded by allocating capital to other countries in search of growth. This has had downstream implications for the country and the “deindustrialisation” trend that everyone is justifiably concerned about.
In some cases, there are mining giants that no longer have any exposure to South African operations at all. They are listed on the JSE purely to access the deep pools of mining capital that provide liquidity in the stock.
Conversely, there are also companies that are focused only on South Africa – and in some cases, only on one commodity as well! This is the riskiest way to play the mining sector, as these companies face the biggest impact from commodity price movements or regional risk changes. These things are often far beyond the control of management.
But is diversification always the answer?
Not necessarily, no. Investors can diversify their own portfolios by owning a basket of mining stocks that deliver exposure to different commodities and geographies, should they so desire.

This is the age-old debate of course: should executives diversify exposure on behalf of shareholders, or should this be left to investors to do?
One of the arguments that is rarely considered is the importance of stakeholder vs. shareholder management. It’s easy enough for shareholders to diversify, but people building their careers in an organisation can’t spend their mornings on copper and their afternoons on gold unless their employer has chosen to go this route.
Issues like attracting and retaining talent sometimes push CEOs in a direction that doesn’t always make sense to shareholders.
Mining sector capital cycles are tough, as mining companies must strike a balance between production increases and near-term returns to shareholders. It often feels like there needs to be a healthy tug-of-war between management teams and shareholders for the excess cash in the business. Usually, it’s best if both sides feel like they are winning.
With that out of the way, let’s dig into the latest numbers.
BHP: where more than half of EBITDA is now from copper
Right here on the JSE, you can invest in the largest mining group in the world without your money needing to be exchanged into a different currency. Assuming you had done so 5 years ago, you would’ve enjoyed a share price return of 65% and a total return of 134%. You must never ignore the dividend yield in these mining companies, as in this case it contributed as much as the capital gain in the share price!
The decision to be involved in BHP would require you to be bullish on copper. The company calls this the “engine that is driving BHP’s growth”, contributing more than half of underlying EBITDA for the first time. It also generated enough free cash flow in the latest period to be self-funding.
The 48% increase in underlying EBITDA from copper was driven by a 35% jump in the average realised price, driven by themes like electrification and data centres. Although expected global demand growth of 2.8% in 2026 is below original expectations due to the global disruption of the Iran conflict, it’s still ahead of the 2.1% growth in 2025. When demand is good, prices tend to go up.
And thanks to that spectacular jump in prices, BHP can mask a 3% decline in copper production. It’s certainly a lot sexier to point to a metric like Return on Capital Employed (ROCE) of 26%, up from 17%.
These returns don’t emerge from the ground on their own. It takes a lot of capital to diversify like this. Copper capex was $4.7 billion in FY26, up from $4.5 billion in FY25 and expected to grow to $5.4 billion in FY27. The capex plans are designed to deliver copper production CAGR of 3% to 4% between FY27 and FY35.
What about the rest of BHP?
BHP’s ongoing ability to grow in copper is made possible by the excellent underlying iron ore business. This has been the anchor of the group, with BHP focused on markets that are very far away from Transnet and all the South African infrastructure headaches faced by the likes of Kumba Iron Ore (JSE: KIO).
They have to beat off some terrifying wildlife on the other side of the pond, but Western Australia Iron Ore (WAIO) is the lowest cost major iron ore producer in the world. This operation is core to BHP’s business, with record production and shipments achieved in FY26.
Admittedly, the new record was achieved with growth of just 1% in production in FY26. Average realised prices climbed 3%, driven by Chinese demand and higher energy costs due to the Middle East conflict. With cost pressures in the mining process, underlying EBITDA was up by just 1%.
ROCE slipped from 43% to 41%, although you’ll notice that this is still miles above copper. It helps to have infrastructure that has been in place for decades.
Still, the cash cow that is iron ore is a cash cow does come with a capex bill. They allocated $3.2 billion in capex in FY26, up from $2.7 billion in FY25 and expected to dip to $3.1 billion in FY27.
And here are two interesting facts about emerging markets from the iron ore section for you. The first is that BHP expects China’s real steel production to plateau for the rest of the decade, with scrap playing an increasingly important role. The second is that India is expected to transition from a net exporter of iron ore to a net importer, as domestic iron ore supply is lagging behind steel capacity growth.
Let’s not talk about South African demand for steel. It’s too depressing.
Shhh… quick, over here… BHP is also still producing coal
BHP downplays coal in the earnings narrative, perhaps because they are scared of getting shouted at by environmentalists who believe that the world should run on sunshine, wind and vibes, even though it can’t.
I’m a big supporter of renewable energy, but I also live in the real world. I recognise that since man invented fire, we’ve stood a better chance of surviving out there. Coal is good at making fires and generating energy, whereas Mother Nature tends to have a mind of her own. In the same way that BHP has diversified its operations, we should have diversified sources of energy.
There’s also another good reason why coal gets minimal attention: it’s only 3% of group EBITDA.
In the latest period, steelmaking coal saw production increase by 3% and average prices by 8%. Energy coal production was up 9%, but average prices fell by 3%. Underlying EBITDA was up 45% in this business, with an EBITDA margin of 15%.
That margin is much lower than you’ll find in copper or iron ore, as evidenced by the group margin sitting 6 percentage points higher at 59% – the highest level in four years! It’s copper growth that took them there, with coal having a negative mix effect on margin.
Coal capex was just $0.4 billion, down from $0.5 billion in FY25 and also lower than the expected $0.4 billion in FY27.
A final note on BHP
With net operating cash flow up by 17% and capex increasing by only 5%, BHP just unlocked free cash flow growth of 83%. It’s a fantastic set of numbers.
The focus on copper and iron ore as the high margin plays is working. And to make sure that the BHP of tomorrow also has a good story to tell, they are allocating capital to new areas like the Jansen Potash project (capex of $1.8 billion in FY26).
BHP has the balance sheet to take these risks, with net debt of $8.7 billion sitting below the target range of between $10 billion and $20 billion. The net debt to underlying EBITDA ratio is just 0.3x.
DRDGOLD: capex focused on existing operations
As you’ve hopefully realised, BHP’s capex drive is about broadening their group. At DRDGOLD, they are focused on making the most of their existing operations, although there’s a one-liner right at the end of the earnings presentation that needs to be considered carefully. I’ll cover that right at the end.
If you have a look at the presentations section of the DRDGOLD website, you’ll find one from mid-July called Vision 2028 Capital Projects Update. This very official-sounding deck was designed for one thing and one thing only: to explain to shareholders where their capital is being invested.
It was a solid presentation, with an honest appraisal of the difficult situation that the company found itself in during 2023. In their words:
“Ergo was running out of tailings capacity and margin. FWGR was running out of room to grow. Vision 2028 fixes both.”
There we have it. Throw money at your problems and they tend to go away. It works better in mining that it does in retail, that much I can tell you.
Practically, this means that a number of projects at DRDGOLD are in progress. Here’s how R10 billion is being allocated:
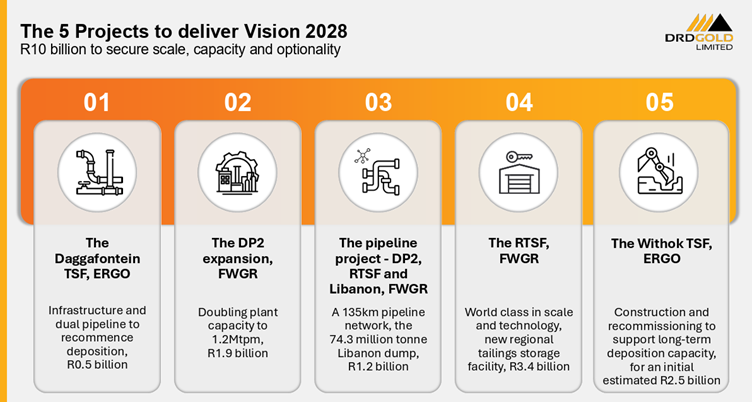
In the latest results, there’s an update to the numbers. The Withok TSF at Ergo has been increased to a R3 billion spend. The other numbers are all the same. What’s a casual R500 million between friends?
Also, though it may be called Vision 2028, that particular project is only expected to be completed in 2029. Perhaps Vision 2029 didn’t sound quite as appealing.
Jokes aside, as DRDGOLD doesn’t come close to the scale of the mining giants out there, they have to be more cautious with how they allocate their capital.
What do the latest numbers look like?
The year ended June 2026 is highlighted by DRDGOLD as being the 19th consecutive year of dividends. Not dividends growth, mind you – simply the existence of dividends. The financial media loves juicy taglines like these, so DRDGOLD is only too happy to provide them.
I think the far more important point is that revenue has jumped by 42%. That hardly sounds like a business that was at a production crossroads, but a deeper look quickly reveals that the gold price increase of 40% over the past year is the driver here.
Therein lies the real story: tonnage throughput actually fell by 2%, so they processed less ore than in the prior year. Thanks to an increase of 2% in the average yield (the amount of gold extracted from the ore), DRDGOLD increased production by just 0.2%. The company has been reliant on the gold price behaving itself, a factor that is completely outside of their control.
This slide does a good job of showing you why they need to put heavy capex into growing their volumes and subsequent gold production:
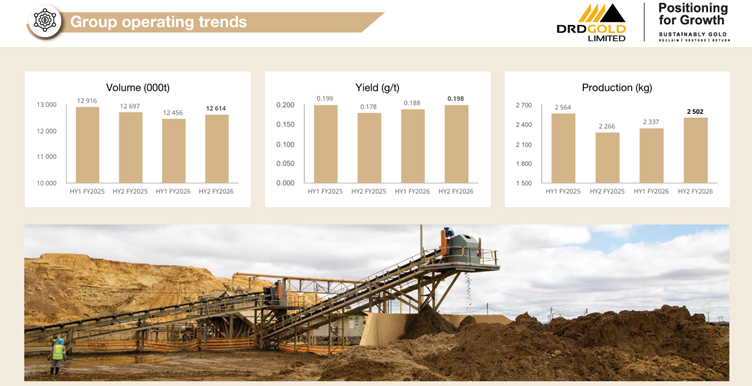
As you can see, volumes have been a sideways story, with production dependent on volatile yields.
The difficulties in extracting the gold has led to cash operating costs per kilogram increased by 7%. This shows you how quickly things could’ve gone wrong in the absence of an increase in the gold price. But this also means that in a year where the gold price does really well, DRDGOLD banks the benefit of high operating leverage (the prevalence of fixed costs in the cost structure).
That’s exactly what happened recently, with operating margin jumping from 47.7% in H2’25 to 61.2% in H2’26.
Here’s the real kicker: H2’26 HEPS of 268.7 cents is higher than total FY25 HEPS of 260.8 cents! In six months, they made more than the entire prior year. Life is good when your only commodity in your mining company is experiencing a generational upswing.
DRDGOLD’s outlook: more production, but watch those costs
Guidance for FY27 is for production of between 160,000oz and 170,000oz, which is odd when the rest of the report focuses on kilograms.
This has forced me to learn that one kg of gold is 32.1507 troy ounces. The converted guidance is production of approximately 4,976kg – 5,288kg vs. production of 4,839kg in FY26. That’s a 6% increase at the midpoint.
Before you get too excited at the prospect of all this additional gold, the cash operating cost is expected to climb to R1,099,000/kg. That’s a 13.6% jump from FY26, suggesting that inflationary pressures are coming through thick and fast.
There’s also planned capital investment of R3 billion in FY27, down from R3.5 billion in FY26. Although shareholders will be happy to see a dip in capex, they will also be wary of overruns.
And what about that throwaway comment I referenced earlier? That one-liner in the preso? Well, on the last slide, the final bullet of the outlook section is a note about DRDGOLD “exploring growth opportunities beyond South Africa.”
Hmmm.
HEPS may have just increased by 89% at DRDGOLD, but the company famously has a conservative balance sheet that doesn’t use debt. I hope that they won’t bet the farm on opportunities beyond our borders. South Africa has many challenges, but investors will be nervous of any foreign capital allocation during a period of heightened capex in the existing operations.
The last company that bit off way more than they could chew is Gemfields (JSE: GML). We all know how that ended, with the share price down 83% over 3 years.
Taking risk can be a good thing, but too much of it can kill you.


Really missing the summary of all of the JSE.
Thank you for the comment. I know it’s a significant change, but one that had to be made unfortunately. I never wanted to do high-level summaries when I started this platform and I think I lost my way with it. Having pre-school age kids is also a huge time commitment vs. the past few years when they were smaller. I hope you’ll get value from the deep dives and continue to read Ghost Mail. In any event, AI summaries of SENS are pretty easy to do nowadays. I want to be the human in the loop who digs a lot deeper!
Loving this new content. Also this little nuggets of insight is real pause for thought: “This is the age-old debate of course: should executives diversify exposure on behalf of shareholders, or should this be left to investors to do?”
Thanks Craig! Great to have you here and especially appreciate the kind words 🙂