")
Listen to the show using this podcast player:
Five years ago, the world was a wild place. We were “staying home and staying safe” – and global central banks were cutting rates dramatically in an effort to stimulate economies under impossible circumstances. This created an unprecedented situation for equities in particular.
It’s certainly been a great time to be invested in the markets, but which indices have done well and which ones have been disappointing in relative terms? How does the local vs. offshore story stack up? What about developed vs. emerging markets? And what of government bonds?
With a great selection of statistics to share with the listeners, Siyabulela Nomoyi of Satrix was a wealth of knowledge in this podcast.
This podcast was first published here.
For more information, visit https://satrix.co.za/products
*Satrix is a division of Sanlam Investment Management
Satrix Investments Pty Limited and Satrix Managers RF Pty Limited are authorised financial services providers. Nothing you have heard in this podcast should be construed as advice. Please do your own research and visit the Satrix website for more information on all their ETF products.

Full transcript:
The Finance Ghost: Welcome to this episode of the Ghost Stories podcast. It’s another one with the team from Satrix. There have been so many of these and they’ve all been really, really good. I’ve enjoyed all of them.
Today we’re going to do something a little bit different. We do try and think of original stuff for these podcasts. Obviously, as our listeners, if you have any ideas of what you’d like to hear from the team at Satrix, you’re always most welcome to share them. But what we will be doing with Siyabulela Nomoyi this month round from Satrix is we will be looking at a five-year view on the markets. And of course what makes that really interesting is five years is a pretty common view to look at. If you go onto Google Finance, for example, you can typically draw a five-year chart. It’s quite common as sort of a longer-term view. But what makes five years really interesting right now is that five years ago the world went mad. So here we will be looking back on five years of life since COVID – it’s not exactly five years obviously, it was March 2020 where everything went crazy. But I mean we’re now in May, so that’s pretty close for a five-years-since-the-bottom kind of view. Let me welcome you to the show first and then we can dig in and see what interesting stats you’ve got for us here.
Siyabulela Nomoyi: Yeah, hi Ghost, and hi to the listeners. Always great to be on your podcast. Second one between us this year and the last one I believe did exactly what it intended to do: educate more people out there. So, thanks for inviting me again. Quite excited about this one as well.
The Finance Ghost: Yeah, absolutely. Look, the insights are always great, and I think today will be no different. So, let’s jump straight into it, which is a look at how we would measure, I guess, just how mad the world can get. Five years ago, things got a little crazy and I know you’ve done some work looking at major drawdowns not just in that year, but versus years before that as well as the years since then, because market volatility is a feature, not a bug, and these drawdowns are going to happen. Covid was just one such catalyst for a drawdown. So, I’m quite curious to understand firstly, how do you actually measure a drawdown? Is it a peak-to-trough thing? Over what period? How exactly do you actually measure these things?
And then what are some of the data points that you’ve found particularly interesting, not just in terms of what happened during COVID but also before and after?
Siyabulela Nomoyi: Yeah, look, five years ago, Ghost, we watched as the President sent us to lockdown. And I remember waking up the next morning looking out the window and felt like we were in a sci-fi movie.
But look, the finance world did not hit a pause button, with so many things digital these days. But you’re absolutely right – there was some form of madness, if I may call it that, that resulted in how things were at that point.
So just to explain the drawdowns quickly as you’ve asked, anyone who’s invested in any asset class or any asset expects it to actually appreciate in value. It should grow to a level higher than what they’ve purchased it. But with asset pricing you seldom see anything that grows in a straight line up.
There’s always price movement along the way, which we call volatility, as you’ve mentioned at the beginning of the show, in financial markets. When you speak about drawdowns, this is where you measure how much the asset has lost since it hit a certain peak level to where it hits its lowest level.
So, silly example – it’s almost like bungee jumping off a bridge. The peak is where you jump off, but the drawdown is an equivalent to the lowest point of how far you fall. And it’s very, very important to actually understand that.
The Finance Ghost: That’s – sorry, that’s a great analogy by the way. That’s a very good analogy, Siya. I like that. Bungee jumping is exactly it.
Siyabulela Nomoyi: Yes. And it’s very important to actually understand firstly how far you’re going to fall because now you understand which ones you can actually take in terms of the risk that you want to take. So that part is quite important.
Also, once you jump and you get to the bottom, you start to actually go up again. So, in 2020, when countries went into lockdown, there was a lot of selling of assets which then pushed down their prices, causing massive drawdowns. In such periods, the riskier asset class is actually classified by the more drawdowns it can have. And we saw that in 2020 with equities leading the way with some big negative returns.
We saw the China and India equity markets coming off as one of the worst in the equity indices that I looked at. And they actually pulled the MSCI Emerging Markets equities down with them as well. What was great to see though was seeing global bonds being a safer asset class as expected in 2020, which they only had like 2% as the worst drawdown during that period. While gold also did better in 2020, having a drawdown of about 10% and those are in USD.
What was also interesting was that healthcare, sometimes it’s seen as a defensive sector, but it also went as far as close to 20% down in 2020. So, look, there were many country focused equity indices that had huge drawdowns that year – UK down 29%, locally we hit a 22% drawdown – many, it was a brutal year. And what was interesting, and we can speak to that when we further down the show, is that some of the country-specific equity indices going the same direction in terms of returns before 2020, but there was some divergence that we saw from 2020 and also after that. And we can speak about what happened there.
The Finance Ghost: Yeah, I mean it’s mega interesting. You shared some of these stats with me before we actually did this podcast. I had a look as well and some of the stuff that stood out for me is, you’ve mentioned emerging markets there, China way more volatile even than India. So that shows you as well, that’s emerging market risk coming through essentially. And what’s also quite interesting is the All-Share Index, generally speaking, not always, but generally speaking is actually less volatile than India, less volatile than China, even though we’re an emerging market and we all fall under BRICS effectively.
But I think a big part of that is because of gold. I would wager that the amount of gold exposure in the JSE All-Share actually helps us because gold ends up being subject to larger drawdowns than maybe the dollar for example, as the safe haven currency, but definitely less severe drawdowns than equities, which again is what you would expect out of gold. So I think that actually almost bakes a little bit of resilience into the All-Share Index, which is quite interesting.
And one final observation that I just wanted to make was if you look at the S&P 500 versus the NASDAQ-100 – and the NASDAQ obviously a very tech heavy index – if you have a look in 2020, the NASDAQ-100 drawdown wasn’t as bad as the S&P 500. And I think that’s because the market realised, okay, if everyone’s gonna have to stay home and stay safe, then these tech companies are gonna benefit from that. Certainly much more on a relative basis than some of the traditional industries. But if you then have a look at the period subsequent to 2020, the worst drawdown in the NASDAQ-100 was significantly worse than the worst drawdown in the S&P 500, and that’s because the NASDAQ was then drawing down off a very inflated level.
So what this really shows you, it’s a measure of risk, but it’s not a measure of returns over time, right? This doesn’t tell you anything about how these things have performed over five years. It’s just telling you how strong your stomach is going to need to be along the way. Is that a fair statement?
Siyabulela Nomoyi: Exactly. That’s why I was saying at the beginning is that you actually need to understand the risks that come with the – whether it’s an asset type or a sector – that come with that, because at a certain point it’s going to hit some drawdown and you need to understand why that’s happening and how far that actually can go and what to do at that point.
So definitely, when you’re looking at these different indices, they are showing you how far they can actually go depending on what period you are in and which ones have been a bit safer when you compare them.
The Finance Ghost: So if we then look at the actual returns, and here what’s quite interesting is you can look over five years and three years. So essentially over five years, you’re basically assuming that you had the guts to go and buy the dip. Maybe you didn’t time it absolutely perfectly in March 2020 and do that Sasol trade that everyone loved so much. But let’s say, you know, you waited a couple of months and then you really went for it, or you just bought five years ago, whatever, that was the first time you got in the market.
Whatever the case may be, the returns over five years, given that depressed base, are obviously going to look better than over three years. And the way to do this is to annualise the return because obviously your assumption needs to be, well, if you’ve been in the market for longer, the market gives me returns on average every year – we know that’s not quite how it plays out – so you should have seen more growth over five years than three years.
So when you’re comparing a period, it’s not about saying, oh, what’s the total growth? Because it’s not an interesting insight to say, well, it grew more over five years than three years. You actually annualize the growth, right? To say, well, what is it per year?
And so if you’re coming off a more depressed base, then your annualized growth is better. But I think if you look over three years, then some of the value of investing consistently also comes through. You know, you don’t have to pick the bottom. This is something that we say quite often is you, you can also just kind of look for good entry points and invest consistently.
So what have been some of the insights that you’ve seen from looking over five years versus three years, for example, what stuck out for you?
Siyabulela Nomoyi: The crazy part of what happened in 2020 – okay, let’s just go back to everyone sort of gets into that panic even after gaining 200%, let’s say, for instance, previously. I mean human beings just start to panic when they see 5% drawdowns or 5% return on their asset, especially if it’s the first time they’re seeing that.
So it’s also interesting that you brought that term of buying the dip. This is where the whole thing of buying the dip came in with a lot of social media chanting behind it as well in that period. And I’ve seen a lot of people being hurt by it because they’re just buying the dip based on just buying it, not further information on what’s happening behind that, what the fundamentals are and all those things. So while there have been some striking some proper luck on it, as you say, if you just – maybe it was the first time you were trying out investing and you just literally just bought into that March 2020 dip and you just get those great returns after that.
So in 2020, even with those large drawdowns, some of those indices actually recovered even before the year had ended. But what was interesting was the China equities since then decoupling from the rest of the market, not really recovering, in fact doing even worse after that as they continued with their lockdown policies and they also had other major issues afterwards.
But on your point about a depressed base back five years ago, definitely there is a huge difference between when you’re looking at three-year numbers versus five-year numbers, especially in our local market, with the latter giving you way more. So the differential obviously is also going to be impacted by what has been happening recently as well.
But if you look at resources, for instance, locally in annualised numbers, if you just look at the last three years, they would have given you -1% per annum if you’re holding in that period. While if you extend that, go back five years, that would have given you 19% per annum, showing really that depressed base that you are talking about from 2020.
Looking at local financials, 10% per annum in the last three years but over five years double that per annum. Same goes for the broader indices like the All-Share Index and even the Top 40 indices where in three-year numbers, in five-year numbers they’re doubling the returns per annum when you’re looking at three-year numbers.
But on the international front, the local investor would also have had influence in their experienced returns from the currency exchange as well. Of course, all our investors who buy the Satrix offshore ETFs for instance, know that they have the pricing on them in rands. So, it really matters to them how the currency behaves.
But on the offshore side, as mentioned, China really did poorly and then just continued to drag while other markets were really recovering in 2020 and onwards. So, on five-year numbers, the MSCI China index only did 2% per annum while on a three-year basis things look way better, especially with the last six months or so with the index giving investors 12% per annum if you’re looking at that period.
One index that has done very, very well and then speaks to your point about maybe it’s not about timing the market really, so if you’re looking at the Nasdaq which is investors getting 21% per annum through all the turmoil since 2020, which really shows that it’s really timing the market, not really trying to time the market. A lot of people say that, because even looking at 10-year numbers, the NASDAQ, which is an index that is tracked by one of our offshore ETFs has done 22% per annum, so very good in terms of long-term investing as well.
But both locally and offshore, definitely Ghost, equities had been strong while in South Africa we saw the nominal bonds as well also giving good returns while offshore bonds were quite poor on a five year basis.
The Finance Ghost: Yeah, some observations there from my side. So it says a lot about the South African economy over the past 10 years that the bonds did almost as well as equities. I mean that is not what should be happening really, especially over a long period like that. And alas, it has been a period of low growth.
I think on the debate of time in the market versus timing the market, the classic saying, I think that within any kind of reasonable range of multiples there’s a lot of truth in it. But I think you have to be careful about buying into the big hype.
So I’ll give you a great example here. Over 10 years, if you skim the list of these returns and maybe we can actually include this table in the transcript of the podcast.
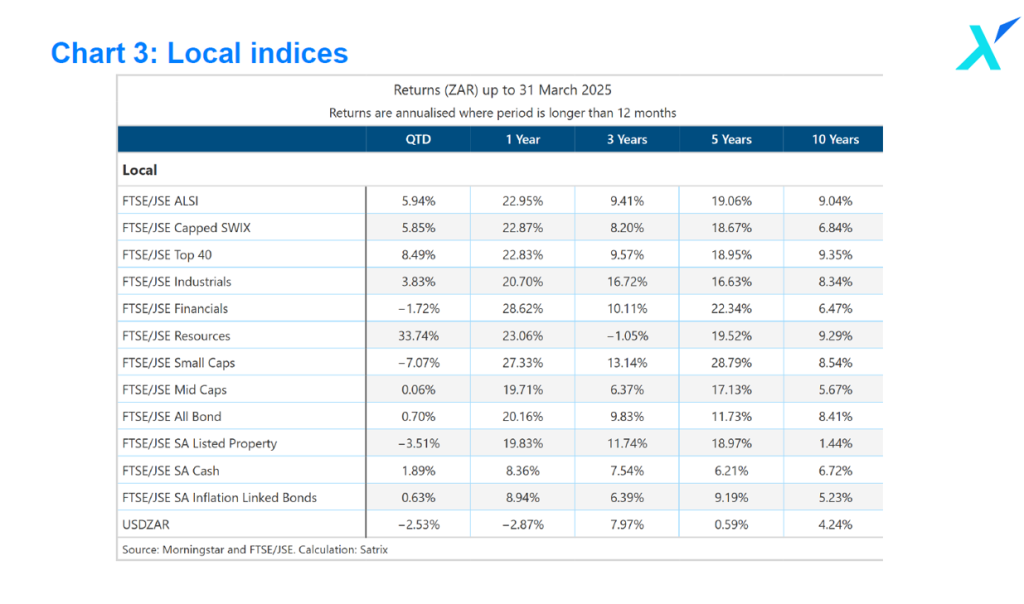
Note: this table shows total returns
But the one that sticks out as being very poor over 10 years is the South African listed property index, annualised only 1.4%. Now I’m guessing that would exclude dividends. That would just be the value of the actual ETF. That’s probably not a total return index. So the divvies will definitely help here. But here’s the problem is that 10 years ago you had a situation where the South African listed property market was a bubble. And it was kind of obviously a bubble. I know it sounds like you can say that with hindsight and try and sound clever, but at the time it was pretty clear property funds were trading at big premiums to NAV. They were just doing bookbuilds basically every single week.
I remember, I worked in corporate advisory at the time and I was quite jealous of the advisors who worked in the property space because it felt like they would just get to work and the money would be made – it just fell out of the trees, basically. They would find up some instos, do a book build and away they go.
So that’s one of the ways to tell when a sector is hot is have a look at how much capital raising activity there is. It’s why people use measures like, oh, the number of IPOs in a market to try and gauge where it is in any given cycle.
Another very good example of this on the table actually, and this is now on the offshore side, is if you look at India versus China over the past year, this is just a wonderful example of capital rotation and how profitable that can be. And I would point out that capital rotation is one of the cool things you can do in your tax-free savings account where you can actually sell out of one ETF and into another if you want to take a more active role, you don’t have to, definitely – and it’s not for everyone for sure and all the usual stuff applies.
But if you are someone who wants to get more active, I mean, here’s a perfect example. Over 10 years, this is quite a long-term example now, MSCI China has done 6.9% roughly. India 12.4%. So big outperformance there by India over five years. You referenced China with the lockdowns and how much that hurt them for a while, etc. Horrible. Over five years, China just 2%. India 21.2%. Again, this is both in ZAR.
So India has done really well. They have far more of a services economy than a manufacturing economy, which I think has put them in good stead. They get a lot of the outsourced tech kind of stuff – it lands up in India, so that works quite well.
But if you look over the past year, India -1.1%. So basically that’s just cooled off now, it’s kind of plateaued and you know, the market’s saying, wow, this thing is too hot now. Whereas China is up 36.4%! So again, there hindsight is perfect, for sure it is, but it just shows you if you’re going to go and buy the big hype stuff – the MSCI India a year ago, or the property index 10 years ago, or arguably some of these tech names now, for example, the Nasdaq 100 has only done 3% in the past 12 months in ZAR, your money was ironically better off in the bank.
So there is an element of you need to be in the market for a long time, absolutely. But time in the market is also important because you need to try and avoid buying the big frothy peaks. And that’s why you’ll often see professional investors write about, you know, a market is cheap or a market is expensive. Don’t ignore that stuff when you’re making allocations, because avoiding those peaks actually can save you a lot of pain.
And it’s not as hard as it sounds. You can see when a market is really frothy.
Siyabulela Nomoyi: Absolutely. And it just might be a shock to you, but if you’re going to be sharing that the table with the transcript Ghost, those returns are actually total returns. So 1.4% over 10 years. That really just shows the drag in the capital there.
The Finance Ghost: That’s total. Oh, that’s bad. That’s horrible. Actually, that makes sense, right? Because so many of those property funds are actually trading below where they were 10 years ago. So the divvies have kind of pulled your total return into the green, that just makes the point even stronger. So yes, thank you for confirming that. Don’t buy frothy stocks. That’s the lesson here. Easier said than done. But learning to spot them is an important thing.
Siyabulela Nomoyi: 100%.
The Finance Ghost: So I think we’ve now looked at an example of all these different indices and how the performance plays out. And obviously one of the lovely things about Satrix is you offer so many of these indices as ETFs. You really have this breadth of options. It’s great. It’s so much more than just the Top 40, which is really where the business started from an ETF perspective all those years ago.
One of the things that’s quite interesting as well is instead of just tracking the index that people would be familiar with like a NASDAQ-100 or an S&P 500, you’ve also got stuff like factor indices. Now we’ve done some work before in this podcast with various people from Satrix actually just talking about some of the different types of things you can invest in. But with these factor indices, what has stood out for you? I’m guessing stuff like growth has done well, maybe momentum just because we’ve been in that kind of market, right?
Siyabulela Nomoyi: Quite right, Ghost. So in as much as Satrix is well known for tracking vanilla indices like the Top 40, MSCI World and so on, we’re also quite a strong player in the factor investing landscape or people may call it smart beta if you like.
In fact, that forms probably 90% of my job as I mostly manage our different factor offerings in some of our portfolios. But definitely Ghost, when looking at the offshore markets and comparing returns amongst the different MSCI factor indices versus how the actual MSCI World index has done, growth has done better than the index while momentum has also kept up and even the quality factor has done very well.
Just a quick guide to the listeners on these factors. Quick reminder. So in the momentum index for instance, the MSCI would favour an increased weight in stocks which have been performing well maybe in the last six to 12 months for instance. So hence the word momentum. So they’ve got price momentum. And favour companies that have good historical sales growth, high forward earnings per share growth rates for the growth index for instance. Also in the quality index, they will favour companies that have low leverage or high return on equity and so on.
So they use these sub factors to actually increase the weight in a particular stock or decrease the weight compared to the index like the MSCI world to actually amplify the factor on that index. So that is how they build these factor indices and this is quite similar to how we would also look at factors as well as we offer momentum, value, quality, low volatility and also we have a multi-factor fund in this space.
If you think about all the sub factors – those momentum, quality and growth I was talking about – on the offshore side, the connection would have been info tech there. If you look at the holdings of these three factors, definitely these indices had been overweight info tech. This is why they have been doing very well in the last five, three and five years.
And the factor that actually lost out the most in the last five years or so is perhaps unsurprisingly the low volatility index when compared to the MSCI World index. So the last five years were really not rewarding non-risk takers. You had to be in it to win it. You had to be on the high volatile and much riskier stocks to actually extract performance and do better than the market. So in taking more risk in the last five years you would have been rewarded more because you would have probably picked those high growth stocks and actually gotten a way better return versus the index.
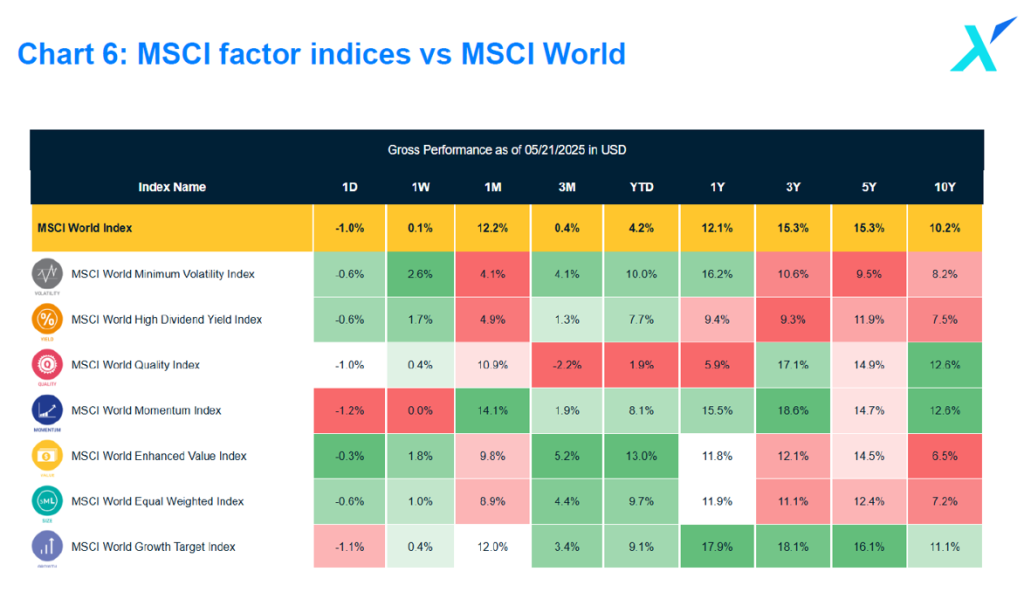
Note: this table shows total returns
The Finance Ghost: I’ll tell you what stands out for me on that table is just how well the momentum index does but just across periods. So you look over 10 years, five years and three years, it’s pretty much comparable to stuff like the quality index which you would understand and that would make sense. But then you look at stuff over the past year and you’ve got the quality index down 5.9%. It’s not terrible. But the momentum index 15.5%, it’s just, you know, carried on almost as the name suggests. So it just, if I look at all of that, it feels like the momentum index really is the one that has been a very strong performer.
The other one that’s interesting to take note of is the high dividend yield index which hasn’t been great over 10 years. I mean it’s not been bad. I guess it’s just compared to some of the others it’s a bit down. We’ve been in a world where companies have been rewarded for reinvesting, obviously the high dividend yield stocks are the stocks that are trading on quite a low valuation – so there’s quite a bit of overlap there with stuff like the value index which has struggled – these are companies that are not necessarily reinvesting their capital. They are older school mature businesses. They are the cash cows. They are basically just trying to grow with inflation and then pay out big divvies.
We’ve been in a world that has really rewarded growth and risk taking. To your point, lots of tech, etc. Will that be the case for the next five years? There’s no way of knowing for sure. And that’s always why diversification is helpful. I have a mix of dividend payers and some growth stocks and everything else. But yeah, the momentum index really stood out for me there.
I think my key takeout from this might be to go and do some more research actually on the momentum tracking ETF. I want to go and learn some more about the constituents there and sort of how that momentum is actually calculated and the factor leads to it. So I feel like there’s an upcoming show in this Siya.
Siyabulela Nomoyi: Yeah, absolutely, we can do that. I think it would be a very nice educational piece on factors because they matter in terms of not only just when you’re trying to diversify between asset classes, when you’re going to equities, there’s also different ways to actually diversify, whether by sector or the kind of factor that you want to pull in.
You’ve got indices that will do the work for you. And if it’s currently a period where momentum or growth is doing well, then your portfolio might do better. So might be interesting for the, for, for your, for your listeners as well.
The Finance Ghost: No, absolutely. So I think let’s move on to fixed income. We’ve got to touch on bonds a little bit. We did a little bit earlier talk about some of the bond returns. But traditionally when people talk about bonds, they generally mean it in the context of correlation with equities. And there’s that whole school of thought around a 60/40 portfolio to try and just smooth out your returns over time. But the problem is that if bonds become highly correlated with equities, then that diversification actually doesn’t work. It’s not achieving its stated goal. All you’re doing is you’re now having two asset classes that move together as opposed to two asset classes with low correlation.
And I found it interesting – I looked the other day for a piece that I wrote and the S&P 500 and the US 10-year bond yield were both almost exactly flat year-to-date this year. So despite everything that’s happened out there, you’ve got bond yields in the US on the 10-year sitting pretty much flat year-to-date. Lots of volatility, but back to where they started. S&P 500, same story. Now that doesn’t suggest that these things have low correlation. Clearly, they’re quite highly correlated. But what is the data telling you over longer-term views, etc? What’s your thinking around this bond versus equity debate?
Siyabulela Nomoyi: Yeah, I guess I could say, one of the long-term injuries that came off from 2020 would be this change in the dynamics of bonds and equities. Certainly it’s been a bit of a tough job for managers who tend to mix the two asset classes along with other asset classes as well, especially on the basis of low correlation and hence diversification in bonds and the bond market also offering a lower risk profile than equities.
Just for the benefit of some listeners who might not understand the term correlation. In finance, correlation describes the statistical relationship between the movement of two asset classes or more. You can check the relationship and see how often they actually move together or they move opposite directions. So it measures how strongly and what direction those assets tend to actually move together. We would have a measure between -1 and 1, and 1 being the perfect relationship – so if one asset class is going up, the other one is also going up at the same time. So perfect relationship with 1, and the -1 would be they go in opposite directions. 1 is positive, the other is negative and so on. Then zero indicates no correlation at all. There’s no relationship that you can’t determine what’s happening.
Before 2020 though, the correlation numbers fluctuated a lot. But if you look at global bonds and you measure the correlation between that and the MSCI ACWI index, which is an equity all-country index, the correlations were swinging between 0.2 and 0.4, which is quite an accepted low correlation measure. And that was before 2020.
But since then – and if you remember when we’re talking about the drawdown, so we were speaking about the equity markets down 20% – 30% in 2020 while the bonds were down 2% which is indicating that the correlation is quite low. Then you want to have that sort of like mix of assets where there’s one is one has a lower profile in terms of risk and the other one has a higher profile in terms of risk, for instance.
Since 2020, since then there has been this consistent climb in bonds and equity correlations and there is always this term of bonds giving equity-like returns being said in the market. And indeed that has been the case. And since 2022, which is where anyone felt the high drawdowns both from the equities and the bonds, something that has not happened in decades where if the the equities are going down, the bonds are also going down at the same time, the correlation have shot up between the two asset classes and now they average about between 0.6 and 0.8 which is very, very high for those two asset classes.
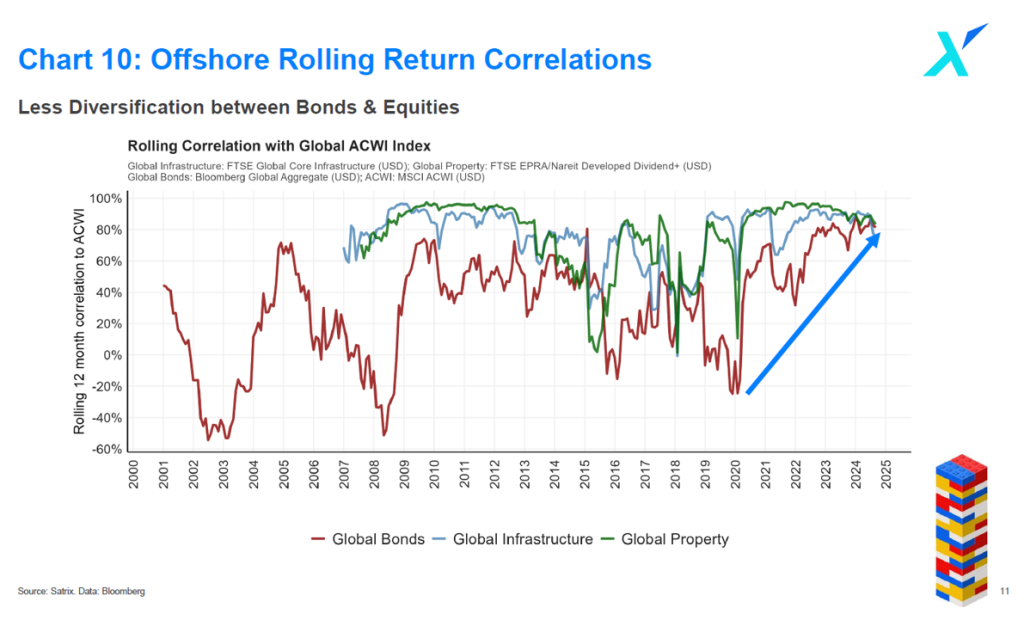
Historically, if you would look at two- to three-month rolling returns between these two asset classes, there were a lot of periods showing negative correlation which would mean that they go in opposite direction in terms of returns, talking to the diversification relationship we know of, but that has ticked up a bit. So as I mentioned, about 0.6 to 0.8 or so in the last couple of years.
And if you remember Ghost in 2020, we had central banks cutting rates on every single meeting. In fact, locally we even had emergency meetings in South Africa. But after that, especially in 2022, central banks started to actually be quite aggressive in terms of rate hiking which pushed yields up massively. I think the 10-year you just spoke of went from 0.7% beginning of 2022 in the same year it shot up to about 4.5% by October of that year. And from our fixed income show we had, we know what happens to bond prices when the yields rise. But then at that very point the number crunchers running quantitative models on stocks now are using a higher discount rates from the fact that the interest rates have been pushed up, suddenly re-rating stocks and the market started selling and sending the equities to negative territory at the same time as the bonds were down. So that really sent those two asset classes down.
Real yields can hurt the stock market but more especially growth stocks which is where we have seen a lot of market volatility this year. Investors and your listeners must always keep watch of what’s happening in the bond market even if they don’t hold any bonds. In fact last night I saw a tweet saying stocks cannot destroy bonds, but the bond market can certainly destroy stocks. Which I thought was, was quite powerful.
The Finance Ghost: That is powerful! I like that. So while you were talking now I did a quick five-year chart on that 10-year. So yeah, 0.5% in 2020 all the way up to nearly 5% in, what is that, October 2023. And that of course is what obliterated some of those tech stocks, at least in terms of that huge drawdown. That’s as we started the show and we talked about some of those big drawdowns in places like the NASDAQ index. It’s what happened there with bond yields.
So all these things are connected at the end of the day, which is why it’s important to try and understand as many of them as you can.
Of course, the other thing that came from low rates, as we bring this podcast to a close, is the rise of the retail investor. They were fuelled by beautiful low interest rates, but also by a willingness to learn about the market. And I think just having access to so many resources to facilitate that learning as well, that’s really been a feature of the past five years or so. I started The Finance Ghost five years ago. That was more just luck than design, to be honest with you. But it was just one example of the sort of information that people suddenly have access to. What are the stats telling you in terms of the rise of retail investors?
Siyabulela Nomoyi: So Ghost, this part is quite interesting to watch. We went from being people who were outside a lot of the time, and then suddenly in 2020 we were locked inside our houses. And some people actually used that to learn new skills and they took advantage of digital tools that they had. And I mean, once we came out of lockdown, you were talking to people in braai gatherings and if you’re jogging with your friend, then the chat started to shift towards so what are you invested in at the moment? Which was quite interesting. So the rise of the retail investor was really driven by things like digital transformation.
If you’re looking at digital platforms like SatrixNOW having lowered barriers to entry, which really enabled a broader demographic to actually participate in investing, there’s also been a great rise in education and accessibility as well. There’s a growing need for financial education to empower new investors, particularly in understanding traditional investment vehicles. I always say to my colleagues that in the investment world, sometimes we’re trying to sell a product that a lot of people don’t understand. The education part is quite important. And shows like the one that I’m in right now actually help in this.
I think product innovation as well has been key, with the rise in index tracking and ETFs, which suggests a shift in investor preference as well, prompting financial institutes to innovate and offer products that actually align with these trends.
Looking at data, in the US we saw in the year 2022 index tracking funds, or other people might call it passive funds, those surpassed actively managed funds for the first time ever in 2022. In fact, in the US the split between those two is around 50% which is quite massive growth in index tracking or rules-based funds. And retail investors have also taken part in that growth, investing in ETFs and they hold around 25% of US stocks.
In Europe, the retail client base has increased as well. In terms of the share in the market, I think it’s about 15%. Can’t recall for which year. With online platforms pulling in over 10 million accounts last year, 2024, there has been a great rise as well in growth amongst young investors.
And in South Africa as well, massive rise in DIY investing. Indexation is around 10% which is quite low in South Africa when you compare that to the us. There’s still quite a big room there for growth in South Africa, even though the adoption of indexation or rule based funds has been accelerated in past few years.
The Finance Ghost: Yep. The retail investor is a topic close to my heart as well, obviously, although plenty of institutions do also read Ghost Mail. But I always have a soft spot for retail investors and it’s great to see those who have kind of made it through the past few years and survived the volatility and have realised this is actually much harder than it initially looked. Those who then push through and carry on learning are the ones who really achieve wealth creation over their lifetime. So well done to them. And of course the people listening to this podcast firmly fit into that category, otherwise they wouldn’t be listening.
Siya, last question for this episode which I’ve really enjoyed, I must say, how has Satrix performed over this five-year period?
Siyabulela Nomoyi: Yeah, so it’s quite exciting to be part of Satrix because it’s done quite well and as expected in a period where indexation or rules-based investing has attracted attention and seen flows over the years. We grew from managing R106 billion assets under management at the end of 2019 to close to R250 billion now at the end of March. And from the products we have put out to the market, we have seen quite an increase in offshore allocations actually.
So if you’re looking at our ETFs, I think we’ve got about 38 ETFs listed on the JSE. And you’re looking at the assets under management of those ETFs, 60% of those are actually our offshore ETFs – investors are looking for more diversification and also more innovation in terms of the types of products that are out there listed on the JSE. And of those 117 listed ETFs on the JSE, we are close to about 35% market share of the market cap of those ETFs.
And just looking at collective investment scheme flows across the ASISA categories and if we exclude money market and commodity ETFs and look at the data up to December 2024, we saw net inflows with 35% of those inflows going into indexation. If you’re looking at the past 60 months or five years from that, 35% of those net inflows, Satrix pulled in about 40% of that. And then back to my point of more flows into indexation on rule-based funds, if you look at the last three years, the net flows into such funds were 50%, so quite an increase of the share in the net inflows. And again, Satrix took 40% off that.
But in 2024, last year, it was a very good year for indexation where those funds took close to 90% of net inflows into those collective investment scheme funds. Satrix being the market leader in this fund, took half of those inflows. Showing remarkable trust from our clients and both from the retail side and also the institutional clients, which we are really appreciative of Ghost.
The Finance Ghost: Those are fantastic numbers, so congratulations Siya and to the team at Satrix. I mean it hardly surprises me, having worked with so many of the team members there and seen the level of care and certainly just passion for the markets, I think, and for the investors who are empowered through products like those offered by Satrix.
We’re going to have to bring it to a close there. We’ve had a lot of fun on this one. A lot of really good data. I’ll try and include quite a few of those tables in the transcript. So if you’ve listened to this in your car or jogging or at the gym or whatever it is you’re doing and you’d like to go and see those tables, there will be a couple of them available on the Ghost Mail website where you can find this podcast as well.
Siya, thank you and thanks for all the effort on pulling the data for this show. It was quite a bit of work and I think it was very, very cool. Of course you’ve set the standard now. So now I expect all these data-driven shows going forward. You see, this is the problem, this is why I’m bad at making the bed. If you’re good at it, then you have to do it every day. If you’re just objectively bad at it, then you don’t have to. So you’ve now proven an incredible ability to make the bed. And this is now our expectation going forward. All these great stats.
Siyabulela Nomoyi: Yes. Okay. No pressure. Thanks, Ghost. And thanks to your loyal listeners as well. I hope this recording will shed some light in understanding some concepts they may not have understood very well and getting to know what has been happening in the market as well in the last five years or so. You know, market volatility will always be there and the people who are in it for the long term while striking a nice balance in terms of diversification in their portfolio, they should be all right.
So till next time, Ghost. Cheers. Thank you.
The Finance Ghost: Thank you, Siya. Ciao.
*Satrix is a division of Sanlam Investment Management
Satrix Investments (Pty) Ltd is an approved financial service provider in terms of the Financial Advisory and Intermediary Services Act, No 37 of 2002 (“FAIS”). The information above does not constitute financial advice in terms of FAIS. Consult your financial adviser before making an investment decision. While every effort has been made to ensure the reasonableness and accuracy of the information contained in this document (“the information”), the FSP, its shareholders, subsidiaries, clients, agents, officers and employees do not make any representations or warranties regarding the accuracy or suitability of the information and shall not be held responsible and disclaim all liability for any loss, liability and damage whatsoever suffered as a result of or which may be attributable, directly or indirectly, to any use of or reliance upon the information.
Satrix Managers (RF) (Pty) Ltd (Satrix) is a registered and approved Manager in Collective Investment Schemes in Securities and an authorised financial services provider in terms of the FAIS. Collective investment schemes are generally medium- to long-term investments. With Unit Trusts and ETFs, the investor essentially owns a “proportionate share” (in proportion to the participatory interest held in the fund) of the underlying investments held by the fund. With Unit Trusts, the investor holds participatory units issued by the fund while in the case of an ETF, the participatory interest, while issued by the fund, comprises a listed security traded on the stock exchange. ETFs are index tracking funds, registered as a Collective Investment and can be traded by any stockbroker on the stock exchange or via Investment Plans and online trading platforms. ETFs may incur additional costs due to being listed on the JSE. Past performance is not necessarily a guide to future performance and the value of investments / units may go up or down. A schedule of fees and charges, and maximum commissions are available on the Minimum Disclosure Document or upon request from the Manager. Collective investments are traded at ruling prices and can engage in borrowing and scrip lending. Should the respective portfolio engage in scrip lending, the utility percentage and related counterparties can be viewed on the ETF Minimum Disclosure Document.
For more information, visit https://satrix.co.za/products