Corporate actions may be quiet, but JSE Limited is doing just fine
There’s much to learn from Nedbank’s interim numbers and their focus areas
Corporate actions may be quiet, but JSE Limited is doing just fine (JSE: JSE)
There’s much more to the owner of the JSE than people think
JSE Limited is a listed company. This always surprises market newbies.
People refer to “the JSE” as the exchange, but it’s also a listed company with a market cap of R13 billion and a 12-month share price increase of 12%. Add in the dividend and you get to a total return of over 19.5%. Clearly, they are doing well.
But how can that be? All we hear about is companies delisting from the market. Surely the JSE is going bankrupt at the speed of light?
Although losing listed companies isn’t helpful, the truth of it is that companies with very little liquidity aren’t of much value to the exchange. If they just sit there, often late on financial reporting and dealing with other issues, they just cause far more headaches than they are worth.
Another important point is that the equity market is just one part of the business model at JSE Limited. There’s a vibrant debt market for example, along with other areas like derivatives. The JSE is also required to have an enormous regulatory capital balance (currently R835 million), so the results are impacted by investment returns on that capital. It’s not just about the number of listed companies.
Here’s the proof: we certainly haven’t seen a 14.1% increase in the number of listings on the market, yet that’s the revenue growth that the company achieved for the six months to June 2026. Interesting, right?
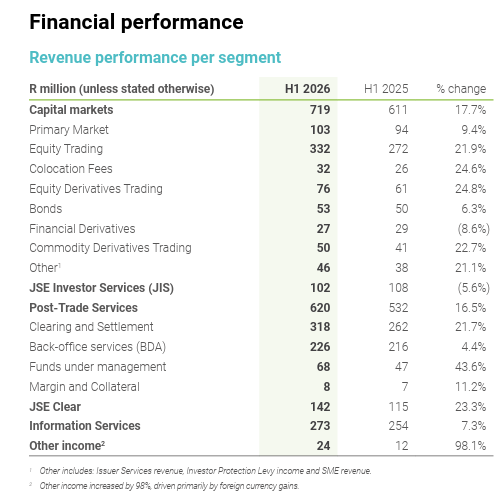
This table shows you how diversified the business actually is:
One area where the lack of activity is being felt is in JIS, which earns revenue based on corporate actions (among other things). JIS was down 5.6%, although I suspect that the underlying corporate action revenue was down by a lot more. The corporate finance industry (where I spent several years after articles) has been forced to focus on private company transactions in recent years, as there just isn’t enough going on in the listed space.
Total expenditure grew by 11.5%, so they have achieved margin uplift (revenue growth was ahead of expenses). I must point out the 22.8% increase in personnel expenses within that number. This is something to keep an eye on, although a fair chunk of it seems to relate to “organisational redesign”. If you accept the company’s adjustment for once-off costs, then personnel expenses were up by 7.8% – a far more reasonable number.
Earnings before interest and tax (EBIT) increased by a juicy 21.4%. Below that line, net finance income actually declined by 9.8%, so that took some of the shine off.
Net profit after tax increased by 16.9% and HEPS was up by 18.8%.
Net cash from operations was up by 20.6% to R625 million, so there’s solid conversion of EBIT (R774 million) into cash. But the capex number really stands out, having ballooned from R27 million to R110 million. They don’t really give further details, noting only that they are focused on “protecting and growing the core business” – in other words, it’s a mix of sustaining and expansionary capex.
This is a strong set of interim numbers. Revenue will hopefully continue its positive trajectory in the second half of the year, as expense pressures are coming through the system. The company has revised its full year 2026 operating expenses growth to 6% – 8% (up 100 basis points vs. previous guidance). Full year capex is expected to be between R190 million and R230 million, in line with previous guidance.
Ghost Bite: JSE Limited is certainly investing heavily for growth. I’ll always want to see this translate into more listings, but the business is much broader than that.
There’s much to learn from Nedbank’s interim numbers and their focus areas (JSE: NED)
The strategy in Africa is one thing, but the South African numbers are filled with interesting nuggets
Nedbank has released results for the six months to June 2026. Before I give you my views on them, I want to thank the group for valuing the Ghost Mail audience. Nedbank has placed their results on the Ghost Mail website for your convenience. Please do check them out!
As always, what you’ll read below is my independent take on the numbers.
The green bank came into 2026 expecting a year that would be anything but green. Headline earnings were flat for the six months, with the group noting that this outperformed their expectations. I must immediately highlight that if you exclude the base effect of Ecobank, you’ll find headline earnings growth of 12%. Diluted HEPS on that basis was up 15%. That’s more like it!
Another stat I’ll quickly deal with is the credit-loss ratio, which has moved up from 81 basis points in H1 2025 to 95 basis points in H1 2026. The retail book is currently running above the through-the-cycle target range, so that’s a concerning data point for South African consumers. There’s been a particularly nasty spike in home loans and credit cards.
Just when investors in South African consumer stocks thought it couldn’t get any worse, we get a data point like this. Sigh.
Nedbank’s interim dividend per share is up by 2%, so that’s probably the fairest reflection of the underlying growth in the group at the moment. The numbers only inched upwards as Nedbank moves through a critical transition phase.
But the future is what really counts. Nedbank is making significant strategic changes to their group that will hopefully pay off in years to come. With the shares trading on a P/E multiple of roughly 7.5x, the market isn’t exactly putting a premium on the growth prospects right now. Nedbank bulls will argue that this is where the opportunity lies.
The obvious strategic change for me to mention is in Africa. Having gotten out of Ecobank, Nedbank decided to go after a controlling stake in NCBA Group. This is an East African financial services group that would give Nedbank a far more compelling presence in Africa than they’ve had before.
An argument could certainly be made that the 21% stake in Ecobank was a half-pregnant strategy, which simply doesn’t cut it vs. what competitors like Absa (JSE: ABG) and Standard Bank (JSE: SBK) have been doing on the continent. But with NCBA, the size of the prize after this deal is a controlling stake in a tier 1 bank in Kenya. That’s a whole lot more interesting.
In terms of the deal process, the NCBA offer closed on 10 July and was accepted by enough holders for Nedbank to achieve the desired 66% stake. They now need to achieve the various regulatory approvals to get the deal across the line.
But here’s the thing: even with this transaction, the pro-forma split of headline earnings would be roughly 86% from South Africa. The Africa story is becoming more interesting, but remains small overall.
In Nedbank’s home market, the recent acquisition of iKhokha is an important step into the SME market. The integration of Eqstra has given them a stronger business in fleet management. We have a very competitive market, with Nedbank trying to focus on specific growth engines.
This means we need to take a closer look at the segments.
The Corporate and Investment Banking (CIB) business, which focuses on the biggest corporates, achieved growth in advances of 8%. This part of the business tends to be driven by sector specialisation and deep relationships. For example, trade finance revenue was up by 18% thanks to flows in commodity trading and agriculture.
Deposits went up 14%, so these companies are sitting on significant cash at the moment. Non-interest revenue increased by 16%, driven by strong deal flow.
In Business and Commercial Banking (BCB), which focuses on the mid-market and SME space, advances were up 6% and deposits grew by 7%. This segment doesn’t appear to be as cash flush as the biggest corporates. Non-interest revenue increased by 14%.
In Personal and Private Banking (PPB), which is the retail banking segment, main banked clients actually increased by 2%. I think that’s pretty good when you consider the competitive bloodbath out there. On the higher income side, they grew clients in Private, Wealth and Stockbroking by 8%. Another juicy growth engine to note is insurance income, up by 21%.
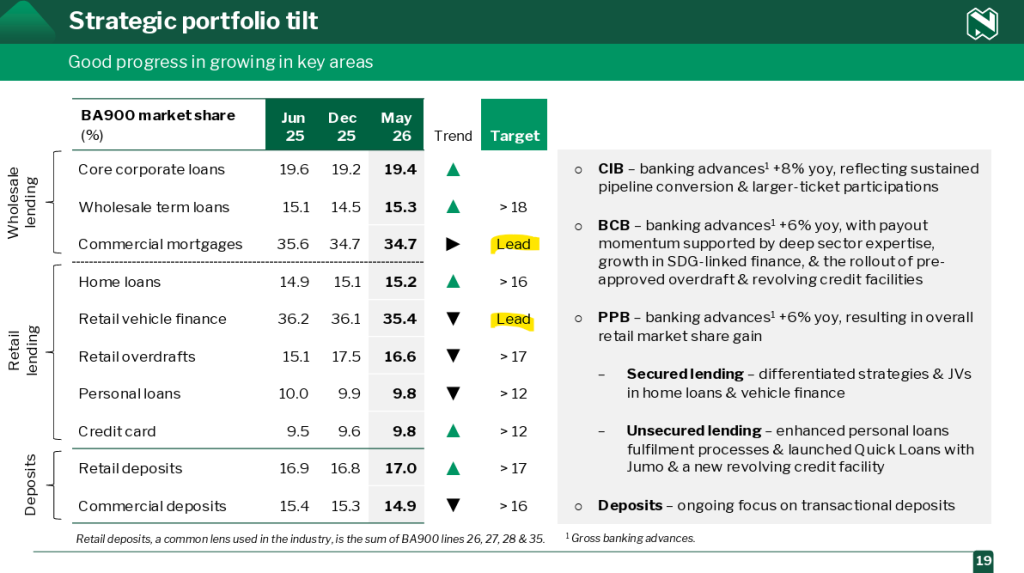
With deposits up by 4%, retail deposit market share increased from 16.8% (December 2025) to 17.0% in May 2026. Their target is to be above 17%, so that’s encouraging.
This is a good opportunity to bring you a particularly interesting slide from the analyst presentation. Regulatory filings (the “BA900” reference) allow Nedbank and its competitors to accurately work out their market share across different categories. As you’ll see below, Nedbank is actually the market leader in commercial mortgages and retail vehicle finance. I must, however, note the decline in retail vehicle finance market share, something to keep an eye on given how lucrative this space is in South Africa:
Another area that I want to focus on is renewable energy financing. They have exposure of R56 billion to this asset class, with a further pipeline of R26 billion for the second half of 2026. To understand more about this space, I recently recorded a podcast with Tokollo Tau of Nedbank. Listen to it below or get the transcript here.
Overall, Nedbank expects Return on Equity (ROE) – currently at 15% – to move above 15% in 2026. Shareholders will be happy to see that direction of travel.
Ghost Bite: The medium-term goal is for ROE to reach 17%. I can tell you for sure that the additional 2 percentage points will be very hard to unlock. If Jason Quinn gets that right during his tenure as CEO, it will go down as a highly impressive stint in local banking.
Nedbank financials for the six months ended March 2026
“Following the bold strategic decisions we made in 2025 to become more client-centred, unlock growth and cross-sell opportunities, diversify earnings, and enhance productivity, benefits have become more evident across our business clusters in the first half of 2026.”
Jason Quinn – Chief Executive
FINANCIAL HIGHLIGHTS
Headline earnings of R8 405m, up by 0.1% (June 2025: R8 399m)
Revenue of R38 235m, up by 6% (June 2025: R35 981m).
Credit loss ratio of 95 bps (June 2025: 81 bps).
Total operating expenses of R21 696m, up by 3% (June 2025: R21 067m).
Cost-to-income ratio of 56.2% (June 2025: 56.9%).
Diluted headline earnings per share of 1 803 cents, up by 2% (June 2025: 1 762 cents).
Headline earnings per share of 1 841 cents, up by 2% (June 2025: 1 800 cents).
Basic earnings per share of 1 830 cents, up by 16% (June 2025: 1 571 cents).
Interim dividend of 1 052 cents per share (June 2025: 1 028 cents).
Net asset value per share of 25 486 cents, up by 4% (June 2025: 24 522 cents).
Common equity tier 1 ratio of 12.6% (June 2025: 13.1%).
FOCUSED EXECUTION AND GROWTH
The US–Iran war and the closure of the Strait of Hormuz weighed on the global economy in the second quarter of 2026. Higher energy prices pushed global inflation higher, prompting a more hawkish monetary policy stance in some markets.
The operating environment in SA during the first half of 2026 was mixed. Real GDP growth in the first quarter surprised on the upside, while higher fuel prices drove local consumer inflation up from a low of 3% in February and, in response, SARB’s Monetary Policy Committee increased interest rates by 25 bps in May, taking the prime lending rate up to 10.5%. Industry credit growth strengthened modestly, with corporate credit growth accelerating off a low base, while household credit growth improved gradually but remained constrained by affordability pressures.
SA’s economic outlook continues to show encouraging signs of improvement, underpinned by a more credible fiscal trajectory, progress on structural reforms, and recent credit rating upgrades. Many of the country’s positive prospects as an attractive investment destination remain intact despite global uncertainties and the conflict in the Middle East.
Headline earnings (HE) for the 6 months to 30 June 2026 were flat yoy at R8.4bn, outperforming our expectations at the start of the year. HE benefited from improving net interest income growth, strong non-interest revenue growth and very disciplined expense management, offset by a higher impairment charge and no further recognition of associate income from Ecobank Transnational Incorporated (ETI) following the disposal of our investment in 2025. When excluding the ETI base effect, HE growth was strong at 12%, reflecting a strong underlying operational performance. Diluted HEPS increased by 2% to 1 803 cents and growth was ahead of HE growth due to the run rate impact of the well-timed share buybacks executed in 2025. Return on equity (ROE) of 15.0% (H1 2025: 15.2%) remained above the group’s cost of equity of 14.0%. Balance sheet metrics remained strong, supporting the declaration of an interim dividend of 1 052 cents per share.
Following the bold strategic decisions we made in 2025 to become more client-centred, unlock growth and cross-sell opportunities, diversify earnings, and enhance productivity, benefits have become more evident across our business clusters in the first half of 2026. In CIB, growth momentum improved as stronger, more diversified, pipeline conversion and participation in larger transactions supported advances growth, while trade finance and commission and fee income benefited from strong deal flow. In BCB, investments in the new cluster and recent acquisitions have started to deliver revenue benefits, with advances growth accelerating, commission and fees increasing strongly, and early synergies emerging from the iKhokha and Eqstra acquisitions. In PPB, growth and efficiency initiatives supported continued advances momentum, market share gains in advances and deposits, very strong growth in insurance and payments, and further productivity improvements. In NAR: SADC, strategic execution supported strong advances and NIR growth, improved operational efficiency, and an increase in ROE.
In Q1 2026 we announced our intention to acquire a controlling interest in NCBA Group plc, a leading East African financial services group, supporting our ambition to grow and diversify earnings in attractive markets. The offer closed on 10 July 2026 and was accepted by shareholders representing 79.9% of NCBA shares in issue, enabling us to achieve our targeted 66% shareholding. Key regulatory approvals have been obtained, with the remaining approvals expected towards the end of Q3 or early in Q4 of 2026.
We continued to make good progress on our strategic value unlocks. Digital volumes and values increased strongly as more clients across all our businesses embraced the benefits and convenience of digital channels. Our AI and data capabilities are delivering tangible benefits across revenue generation, credit effectiveness, client experiences, productivity, cost optimisation, and fraud processes. Client satisfaction metrics remained at the top end of the peer group, while the value of the Nedbank brand increased by 16% to R24bn. Total clients increased by 4% to 8 million, supported by growth across individuals and SMEs. Under strategic portfolio tilt, we recorded market share gains in home loans, credit cards, wholesale term loans, and retail deposits. Our increased focus on insurance and payments saw strong growth, with MyCover insurance gross earned premiums increasing by 23% and digital payments NIR in PPB increasing by 15%. Lastly, lending to clients that creates lasting positive impacts, sustainable development finance, increased to R213bn, representing 21% of total gross loans.
Looking forward, SA GDP growth is expected to improve modestly to around 1.3% in 2026 and 1.4% in 2027, supported by resilient consumer spending but constrained by weak business confidence, subdued fixed investment and global energy price risks. Inflation is expected to average around 4.0% in 2026, remaining above SARB’s 3% target but within its tolerance band, and the prime lending rate is expected to increase by a further 25 bps in September 2026 before declining in 2027. Banking conditions should improve gradually, with credit growth projected to remain positive and end the year at around 7%, although risks remain tilted to the downside. We expect the underlying growth momentum across all our businesses to continue in H2 2026, supporting an improvement in HE growth from the flat outcome reported in the first half. ROE is expected to remain above 15% in 2026, heading towards 2025 levels. In the medium term, we remain focused on delivering an ROE of around 17% in 2028, underpinned by stronger revenue growth and continued operational efficiency gains.
I thank all our Nedbank colleagues for their contribution to the strong underlying momentum evident in the first half of the year. We deeply value the continued trust of our clients and the constructive engagements with investors, regulators and other stakeholders. As Nedbank, we remain committed to using our financial expertise to do good.
Jason Quinn
Chief Executive
* Our guidance and targets are not profit forecasts and the group’s joint auditors have not reviewed or reported on them.
This short-form announcement is the responsibility of the directors.
Investment decisions should be based on consideration of the full unaudited condensed consolidated interim financial results for the 6 months ended 30 June 2026, as this announcement does not contain full or complete details.
MTN’s share price has been slashed in response to recent numbers (JSE: MTN)
The Q2 slowdown in MTN Nigeria is the likeliest cause of this pain
Before I dig into the recent financials from MTN Nigeria and MTN Ghana, I want to highlight the progress made on the IHS transaction. MTN is in the process of acquiring the remaining shares in IHS, giving them more control over the infrastructure that they rely on across Africa. Importantly, shareholders of IHS have approved the transaction. This leaves them with only the regulatory approvals to get in place.
Now, let’s get to the really juicy stuff.
MTN’s African subsidiaries always release their results before the mothership brings us numbers. In practice, it’s the African numbers that tend to drive the MTN share price, as the South African business is a relatively steady (and slightly boring) story.
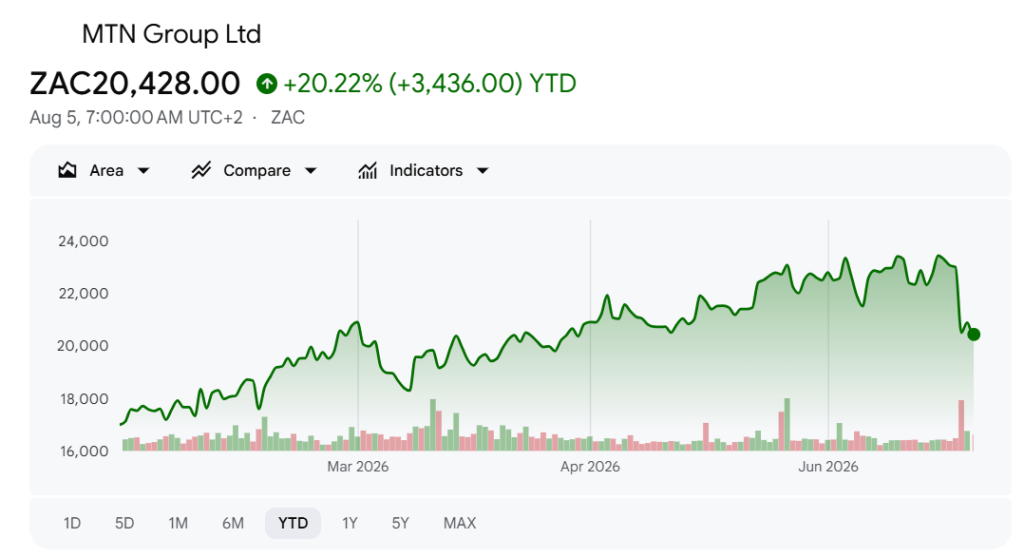
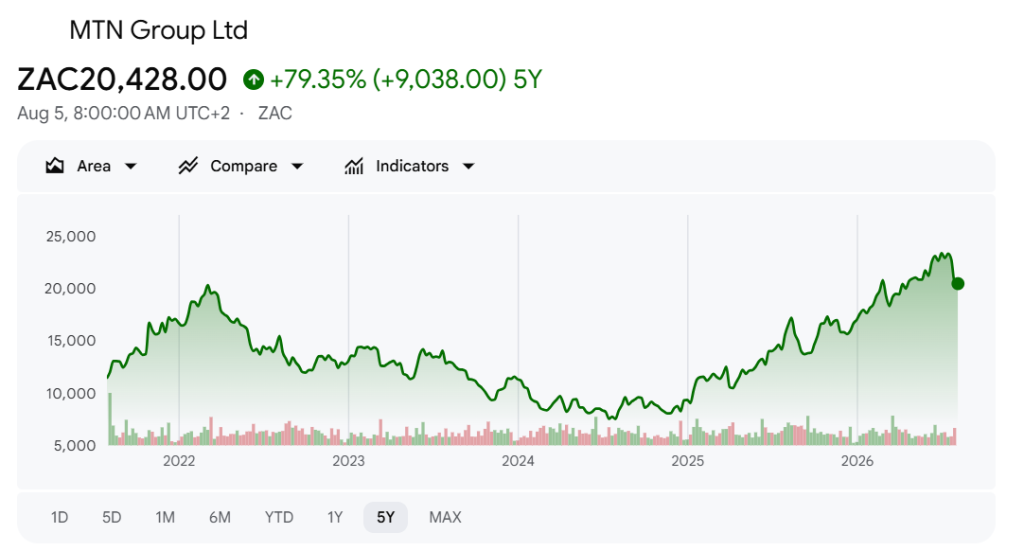
The recent updates from MTN Nigeria and MTN Ghana drove a nasty correction in the MTN share price:
If you look at the numbers through a six-month lens, then both of the subsidiaries look great. But if you take a quarter-on-quarter view to assess momentum through the period, you’ll find a problem in MTN Nigeria that has spooked the market.
Buckle up!
MTN Nigeria: a wobbly, or a bigger problem?
We begin with MTN Nigeria, easily the most important of the African subsidiaries. This means it has caused the strongest headaches and driven the most exciting upside for MTN investors. After all, Africa is always a game of risk and reward.
For the six months to June, MTN Nigeria grew subscribers by 8.9% to 92.2 million. They have 55.7 million active data users. This immediately gives you an idea of the growth runway for data relative to other services.
Thanks to an increase in activity per user, service revenue for the six months was up by a juicy 25.9%. That’s ahead of the medium-term guidance of “at least low 20% growth”. It’s also 10.4 percentage points above the inflation rate for the period, so they are delivering real growth here.
If you exclude the airtime and data credit service (which is where Optasia (JSE: OPA) plays), then growth for the six months was 27.3%. You can see why the market has become worried about whether Optasia has any moat at all. The second quarter tells a very different story though, perhaps giving some reassurance to Optasia investors who have seen their share price fall by 31% year-to-date.
To finish off on the numbers for the first half, operating expenses grew by 11.3%, or less than half the growth rate in revenue. This led to EBITDA jumping by 39.2%, with EBITDA margin expanding by 5.3 percentage points to 55.9%. By the time we reach the bottom of the income statement, we find profit after tax up by a delicious 70.6%. Earnings per share followed suit.
The big question is always around free cash flow, as the telcos can be capex-hungry beasts at times. This period was an exception, not least of all because the naira strengthened against the US dollar (much of the capex is driven by US dollar costs). This is why capex (excluding leases) was up by only 1.2%. Free cash flow jumped by a spectacular 73.9%.
All of this is good news alongside the strong balance sheet. There’s a net cash position of ₦116.3 billion, up 11% from December 2025. This is giving them the confidence to pay dividends.
So, what’s the problem here?
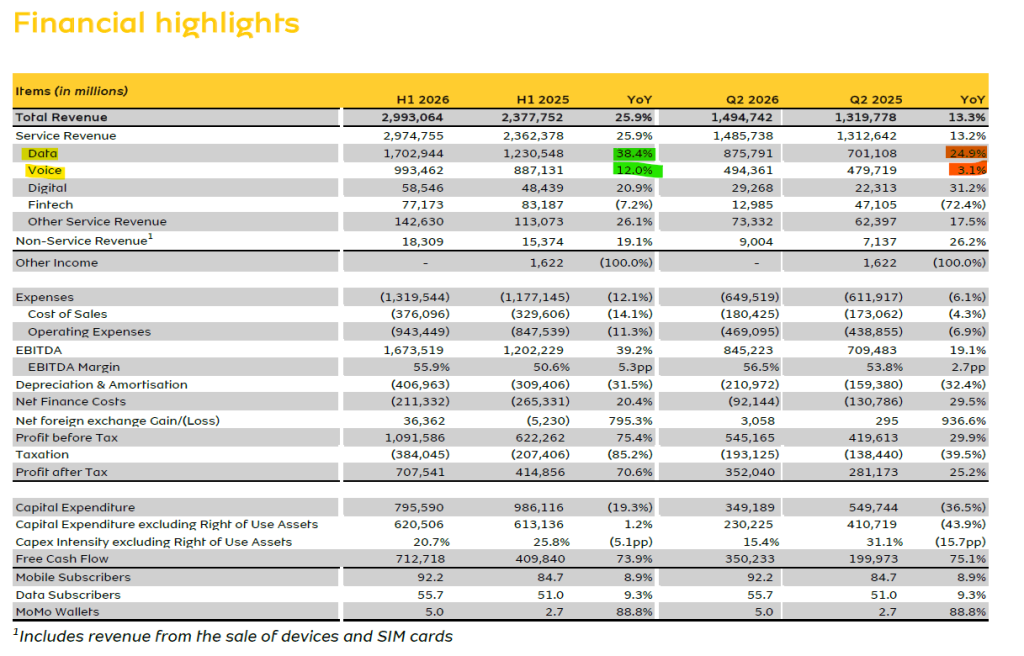
The slowdown in growth in Q2 vs. Q1 is the likeliest cause for the concern in the market. The second quarter only achieved year-on-year growth of 13.2% in service revenue, way below the 25.9% achieved for the six months. Profit after tax for Q2 increased by “only” 25.2%.
The impact of the airtime credit suspension is clearer here, as fintech revenue fell by a nasty 72.4% in Q2. Fintech only contributed 3.6% of service revenue in the comparable period, but that’s still enough to have knocked growth by a couple of percentage points.
The bigger stress points are data and voice revenue, where growth in the second quarter was way down on the first quarter. I’ve indicated in the screenshot below where you would see those percentage movements:
Perhaps the lack of airtime credit services in the second quarter had a much bigger impact than MTN was letting on? If so, then MTN has severely downplayed their importance to the market, much to the detriment of the Optasia investment case.
All eyes are on the second half of the year. The airtime credit issues are behind them, so the market will hope to see a return to growth across the board. It helps that capex intensity (currently 20.7%) is expected to moderate – i.e. it should come down, which implies that capex will grow at a slower rate than revenue in the second half of the year.
The medium-term guidance is unchanged. They are aiming for revenue growth in the low-20% region. EBITDA margin is expected to be in the mid-to-high-50% range.
Another point to note is that MTN Nigeria is still keen to carve out the fintech business and turn it into a distinct business.
MTN Ghana: less to worry about (well, mostly)
At MTN Ghana, let’s just get the new risk out of the way first. The company announced that Clydestone has sued the company based on claims that MTN used Clydestone IP for the launch of mobile money in Ghana. MTN Ghana has come out strongly in response to this case, noting that they are not recognising any related liability.
This is a classic example of a “legal overhang” in the market. Nobody actually knows how it will turn out, but investors need to think about it anyway.
Onwards to the numbers. Mobile subscribers increased by 8.5% to 32.8 million. Active data subscribers jumped by 17% to 21.3 million. It’s a much smaller business than MTN Nigeria, but still a very important one.
Service revenue increased by an impressive 32.3%, a country mile ahead of the average inflation rate of 3.8%. This is significantly higher than the real growth rate we saw in MTN Nigeria. One of the factors was that the fintech business didn’t have any regulatory issues to deal with, so MTN Ghana could just get on with growing their business.
Operating expenses grew by 24.2%, so there’s clearly investment required to achieve these levels of growth. Still, that’s well below revenue growth, so EBITDA was up by 39.8%. This drove EBITDA margin expansion of 3.4 percentage points to 61.8%.
Other notable line items include a 26% increase in depreciation and amortisation, as well as a 12.6% increase in net finance costs. The EBITDA growth was more than enough to cover this, so profit after tax increased by 43.3%.
Capex (ex-leases) for the period was down by 13.3%. This took capex intensity down from 20.4% to 13.0%.
The frustrating thing is that they don’t specifically disclose free cash flow. I can eyeball the numbers and see that it’s gone the right way, but it takes time to calculate properly. MTN Ghana should be providing this number to its investors in the highlights section.
In terms of momentum during the period, the second-half growth in service revenue (29.2%) is only slightly down on the 32.3% for the six months. This shape is repeated in EBITDA and profit after tax. But where you’ll find a big difference is in capex ex-leases, up 12.6% for Q2 vs. a decrease of 13.3% for the six months.
MTN Ghana is ahead of MTN Nigeria in the fintech separation process, having successfully completed the structural separation of the Mobile Money business. It’s just awkward that they now have a legal irritation to deal with.
Ghost Bite: Volatility at MTN is a feature of the story. Now on a P/E of 16x and with group numbers coming soon, they are still trading at a premium valuation that requires significant growth to be justified. The debate is raging around MTN Nigeria’s growth and whether this slowdown will stick. Here’s a five-year chart to give this move more context:
Nibbles:
Director dealings:
A senior exec at Hammerson (JSE: HMN) sold shares in the company worth £204k. This comes just after the company raised capital from outside investors, so that’s not a particularly great look.
A director of a major subsidiary of Vodacom (JSE: VOD) sold shares in the company worth R1.7 million.
A director of Canal+ (JSE: CNP) bought shares worth €75k (around R1.4 million).
The CEO of Sirius Real Estate (JSE: SRE) and a close associate bought shares in the company in their self-invested pensions worth around R775k.
The CEO of Salungano (JSE: SLG) bought shares worth R461k.
An entity linked to a few directors bought shares in Sebata Holdings (JSE: SEB) worth R9k.
As a reminder of how big some of the corporate balance sheets out there actually are, British American Tobacco (JSE: BTI) casually priced $1.5 billion worth of notes as part of a general refinancing of the balance sheet. This is typical of a treasury strategy at a company of this size, with the proceeds likely to be used primarily for repayment of other notes or debts.
In case you’re an IFRS nerd and you want to dig into Sanlam’s (JSE: SLM) new reporting framework, the company has announced the release of 2025 comparative information under that new approach. This is in preparation for the release of interim financial results on 10 September.
Here’s an interesting one: Grindrod (JSE: GND) announced that Value Capital Partners (VCP) now has a stake in the company of 5.239%. This announcement is triggered by VCP moving through the 5% milestone. These sorts of things happen often on the JSE. The difference is that VCP is rarely a completely passive shareholder like most institutional asset managers. Will VCP stop there, or is there a broader plan here?
Zeda (JSE: ZZD) announced that a company named Mandisa Holdings now has 5.19% in the company. This is worth keeping an eye on.
Aimia (JSE: AII) has been busy with its share repurchase programme. The company repurchased 0.2% of its shares during July at a weighted average price of $2.67 per share. There’s literally no liquidity in this stock on the JSE. The local market is waiting to see what this company’s bigger plan is.
Numeral (JSE: XII) released results for the three months to May 2026. There’s almost no liquidity in this tiny (R35 million market cap) company. Revenue for the three months was down 1% at $467k. The group reported a very small headline loss per share.
Here’s a fun one: Old Mutual (JSE: OMU) announced that Old Mutual Zimbabwe’s listing will migrate from the Zimbabwe Stock Exchange to the Victoria Falls Stock Exchange. It certainly has a more exciting name! In case you’re wondering, this has no impact on South African investors.
How do you know whether your investment performance is actually good?
In this episode of Ghost Stories, The Finance Ghost is joined by Siyabulela Nomoyi from Satrix to unpack one of the most important, yet often misunderstood, concepts in investing: benchmarks. From retail portfolios to institutional mandates, we explore why returns only tell half the story and why every investment outcome needs a meaningful point of comparison.
The discussion goes well beyond the basics, covering how benchmarks are selected, the role they play in risk management, the differences between indices and other benchmark types, and why ETFs offer investors an accessible way to measure performance against the market. Siya also shares practical insights into index construction, concentration risk, tracking error and the common mistakes investors make when choosing benchmarks, reminding us that outperforming a benchmark isn’t always as impressive as it sounds.
In this episode:
Why benchmarks are essential for evaluating investment performance
How investment mandates, time horizons and risk tolerance influence benchmark selection
The difference between indices, benchmarks and hedge fund hurdle rates
Why ETFs are a practical way to access investable benchmarks
How index construction and weighting methodologies affect risk and returns
The importance of tracking error, fees and liquidity when assessing ETFs
Why beating a benchmark can sometimes be misleading
Common mistakes investors make when choosing and using benchmarks
The Finance Ghost: Welcome to this episode of the Ghost Stories podcast. I’m your host, The Finance Ghost. My guest today is Siyabulela Nomoyi from Satrix. And let me tell you, we have both been having the Monday of all Mondays. We’ve had to move this a couple of times while we deal with some respective tough stuff.
But thank you for nonetheless making time for this, and I’m really glad that we actually got a chance to sit down and do this in the end.
Siyabulela Nomoyi: Yeah, Ghost, thanks for having me. Mondays are like that; it is what it is. That’s the life. Hi to the listeners as well and thank you for inviting me again.
The Finance Ghost: So, Siya, let’s make the most then of the time that we do have, which I am really looking forward to. And we’re going to be talking about benchmarks today. And that’s because you wrote quite a cool piece recently on this entire topic.
I think that people, when they talk about returns on their stocks or their investments, they’re really only giving half the picture, right? They’re basically telling you how they did, but it doesn’t give you the context of how everything else did and things with maybe similar risk profiles and that kind of stuff. And we’ll talk about that on the show.
But I think let’s maybe just cover why it’s important to have a benchmark in the first place. And obviously this is something that as an ETF specialist, you live and breathe, which we’ll also cover in this discussion. But initially, just to kick us off, take us through why it’s important to actually have a benchmark.
Siyabulela Nomoyi: Sure, Ghost, thank you. So, as you mentioned, the other day I wrote an article on this and believe me, my marketing team actually trimmed it to fit media house limits. I had about five pages of writing on it. In other words, I think it’s very, very important and I hope our discussion can actually shed light on the why of that.
I’m hoping both retail and institutional investors can appreciate this. But choosing the right benchmark is one of the most significant decisions in investment management and one of the most underappreciated as well.
So, firstly, let’s just step back a bit, and ask what a benchmark is before we continue. Just in case there’s someone curious about that part (and has not really or exactly appreciated why we would be talking about today).
So very, very loosely, think of a benchmark as a standard way to test or use to measure and compare how well something performs, right? So, in investments you can use it as a baseline to measure how yourself and how your portfolio is doing; or the market, or any other player that’s out there.
Or if you want to look at peers or anything like that, you can actually look at how well you’re doing in relative terms compared to those.
So, there are investors out there who spend their days trying to beat a certain benchmark (the market in this instance), and so they compare themselves to an index that would be the benchmark. Others actually just prefer to be in line with the market, just want the market exposure and don’t bother with outperforming it.
To quote what I had mentioned in the article, is that for a fund manager, a benchmark is often a constraint, the reference point against which performance will be measured and against which any deviation must be actually justified. So, in investment terms, we would talk about tracking error here or an active return.
But now, if you are sitting in an investment committee, it might function more as a goal, where it acts as a proxy for the return of the portfolio that you expect to deliver.
But also, for risk management as well, it does act as a blueprint; a description of what the market exposure of the portfolio is designed to actually replicate or actually approximate.
But look, a well-chosen benchmark serves all those three purposes simultaneously. It sets a realistic performance expectation, defines the risk profile of the investor, whatever that investor has agreed to actually accept in terms of risk. It also creates accountability as well, which is very important, especially in my field. So, giving both the investor and the manager a shared language for evaluating outcomes.
So, you want to sit there and evaluate whether this manager is doing well, you should ask: doing well compared to what or relative to what? I should just mention that choosing a benchmark should never be a tick-of-a-box exercise. A well-chosen benchmark serves all the purposes that I’ve just mentioned.
It sets a realistic performance expectation. It also defines the risk profile of the investor. As I mentioned, the accountability part. If you are telling me, Ghost, that your portfolio is doing well, I need to just ask you: performing well relative to what? Especially in a space where I need to actually evaluate your answer within some investment risk spectrum.
The Finance Ghost: Siya, thank you so much for setting the scene for us there. And in the world of professional money management (and I think most people listening to this will be retail investors, but if we just borrow from the professionals for a moment) then the benchmark essentially is related to their investment mandate, right?
But for retail investors, it’s not necessarily that formal. You can technically pick whatever benchmark you like. You should just pick something that makes sense. You know, if you’re investing in South Africa, then something like the JSE Index would make a lot of sense. You wouldn’t go and choose something random like another emerging markets index. That wouldn’t really make any sense in the context of that portfolio.
So perhaps just dealing with the professional side of things for a moment, how does the investment mandate of a professional asset manager actually inform their choice of benchmark?
Siyabulela Nomoyi: It’s an important question and I think it covers the entire investment world, whether retail or professional management.
And I’m saying that because I think as a retail investor I might sit at home, look at my returns and I think I’m doing very well for what I’m investing for. But there is nothing that I’m actually benchmarking myself to, to actually see that relative return.
And this is where the word mandate comes in. Just moving into the professional management part, but it applies to retail as well. What is the aim here in terms of the money invested? What is it supposed to do and when? And that translates to how someone actually views the risks that their mandate can actually partake in.
Before this recording, Ghost, we were talking about marriage; weddings. And if my mandate is to actually save and invest for a wedding in six months’ time, my mandate is totally different from if I’m investing for my two-year-old’s varsity fees, for instance.
It’s the same in the professional world, where people are investing in these different unit trusts. Whether you’re talking to a pension fund trustee or a fund selector, what they want in the time horizon is very important, which is influenced by the fact that they would have a mandate for the money that they want to invest.
The mandate actually answers three basic questions which then help with how to actually choose the benchmark. Firstly, what is this money for? Secondly, when does it actually need to be available? And what are the risks that are acceptable in the pursuit of these returns, right?
The wedding in six months versus varsity fees in 16 years example comes in here. Although I think if you have a wedding in six months and you start now, you might be late to the party.
Let’s just look at a pension fund, for instance. They would have long-dated liabilities, right? So future benefit payments. Its benchmark must reflect the duration and also the asset class exposure required to actually match those liabilities over time, right?
If they choose a super conservative benchmark, for instance, they would definitely not be able to actually match those payouts in the future, because there’s inflation and it would have eaten into the real returns of that portfolio.
While if there’s too much risk taken while there’s quite a huge beneficial payout coming very soon, and then the market tanks or something happens in the market, they would fall into the same trap in terms of the payouts.
So, retail clients also face the same challenge on a smaller scale. Someone saving for retirement in 30 years has very different needs from someone who’s preserving capital for property purchase or the wedding example that I made.
So, the benchmark should just reflect the time horizon, the liquidity requirement that talks to when the money is needed, and then the tolerance for drawdowns in terms of what you can take, given that you want to chase the returns that you want.
In other words, the dream must always match the returns and risks profile. So, the risk part is very important to understand. It can be expressed in terms of volatility, tracking error, relative the benchmark, and all those things, as it often does.
But I think it’s very, very important that as a client talking to your fund manager, or as a retail client sitting at home trying to manage your own portfolio, it’s very, very important to just understand firstly what the mandate is, and how that translates to, “Okay, this is what I want to measure myself against” and whether that benchmark actually makes sense.
The Finance Ghost: Lots to think about there. And that’s because benchmarks are confusing things for people who haven’t really dealt with them before, and complex things even for people who have.
And it also gets quite complex when you get into areas like hedge funds, right? Because here they have things like hurdle rates and performance hurdles and that kind of thing, which is not quite the same as a benchmark, because that’s typically how a hedge fund would earn its fees.
Whereas in other types of funds, the benchmark will be just how you measure performance, but not necessarily how they earn a fee. And of course, that is a nuance that people need to understand when they’re looking at fact sheets.
Maybe the other thing to just touch on, Sia, for us is whether or not a benchmark is always an index or can it be something else? Just take us through the differences there between hedge funds and long-only funds and how they think about this stuff.
Siyabulela Nomoyi: The short answer to your question is definitely a no. The benchmark is not always an index. In an index you think about as, “Okay, there’s constituents, create weights for those constituents. And this is the index that I want to follow”.
Yes, a lot of people, including myself, always think of a benchmark as an index that’s made up of constituents. For instance, S&P 500 or the ALBI or just the FTSE/JSE Top 40, for instance, as that index. So institutional investors like pension funds do use non-index benchmarks.
So again here, going back to my liability matching example or what I mentioned previously, is that institutional investors who actually use benchmarks like liability matching, which uses future cash flow projections. So in order to actually manage that part and see if you are successful there, the fund needs to actually always be maintained to track those obligations. It’s very important to just keep track of that.
And of course, the other one would be inflation-linked benchmarks, where maybe there’s like a fixed number or a moving target relative to inflation. So, I’m pretty sure anyone who’s actually listening to this, would have seen funds that target inflation, 3% inflation plus 5 and so on.
So those move with inflation and they change. And then that also influences how an investment manager actually changes their asset allocation to their fund to match how they can actually beat that benchmark.
And the other part is probably some sort of industry or peer group average, for instance. So, an investment manager, for example, let’s say they manage a fund on local equity and then they have an average or the median of the ASISA general equity category as the benchmark. So, they measure themselves versus the peers.
That’s where your question about hedge fund or the hurdle rates that comes in, where in order for them to actually get any performance fees, there should be an amount that actually can go over in terms of their performance, which can allow them to charge the investment fee and then on top of that actually charge the performance fee.
There’s quite a lot of other ways of actually having a benchmark, but it just again fits back to I guess the mandate part that I spoke of previously. And that fits in terms of how you understand or which benchmarks you want to choose for your portfolio.
And also very, very important, especially if you’re someone who… again going back to this performance fee part… if you are someone who’s selecting funds or buying into funds which have that, it’s very important for you as the investor to look at the portfolio and then look at the benchmark and be able to actually evaluate whether that benchmark makes sense.
What’s going to happen there sometimes is that what if that fund manager is always beating the benchmark, then there’s always going to be the performance fee, for instance, and why it actually makes sense, that’s the case.
So, you need to just make sure you understand if that benchmark makes sense. That is a measure for that fund. There’s over 1,600 unit trusts out there to choose from, so you don’t have to stick to one player.
So, if there’s information that you’re not understanding in terms of the benchmark, then you need to evaluate the next one, up until you’re actually comfortable enough to say, this is the fund manager that I want to go with. If you are interested, active management or buying into portfolios that outperform the benchmark.
At the same time, when it comes to the benchmarks that I’ve just mentioned, in terms of fluctuations, they’re linked to a target that’s moving. You should ask: does that make sense in terms of your time horizon and the mandate that you have as well?
The Finance Ghost: Siya, I think the big thing we’re learning today is that the benchmark just needs to make sense in the context of your entire investment strategy and everything you’re actually doing. Because if you don’t understand the risk of what you’re doing, then you’re going to do a really bad job (in all likelihood) of picking a suitable benchmark.
And I will say that ETFs are actually a really good way for people to not just bring market returns into their portfolios, but also just to see how something is performing. Investors can explore the Satrix ETF range to see how different ETFs track various benchmarks and indices. So, I actually do that all the time when I look at a particular stock and I think to myself, “Okay, what would make sense? How would I compare this to, for example, the JSE?”
It’s actually quite easy to go and get a traded price for a Satrix ETF, because the point is, that’s an investable benchmark. As opposed to an index which you can’t actually buy. You need to go and buy an ETF that tracks the index. And then there’s a very small layer of fees, which of course is the Satrix brand promise, to do this as cost-effectively as possible.
And once you subtract that, then you actually get an idea of the investable index, and you can then use that as a benchmark.
Now, you are certainly an expert on indices, you live and breathe this stuff, so perhaps you can just walk us through any other characteristics you want to raise of an index that you would look out for when you’re actually choosing a benchmark.
You’ve already mentioned so many. Is there anything else that you think is worth highlighting for the listeners?
Siyabulela Nomoyi: Sure, sure. Now we’re talking Ghost. That liability matching stuff. Definitely not my area, but ETFs and indices, we can sit and talk about those the whole day. It’s very, very important for clients or investors or anyone who’s listening to actually just understand what that entails.
Because ETFs, they generally just track an index or a benchmark. So as an individual, you can attempt to just track how the certain market performs and not worry about performance. You could just go for an ETF that tracks the JSE capped all share, for instance, for the SA local markets, S&P 500 for the US or the MSCI World. If you’re looking to developed capital markets and so on.
You can’t just wake up and select an ETF blindly, right, for your investments. I would hope not. The ETF you buy into will match back to what your mandate is. Investors looking to access ETFs directly can invest through SatrixNOW as part of their broader investment process. And that mandate helps you to just filter through 140-odd ETFs listed on the JSE, which includes actively managed ETFs.
You need to look at that list and just filter through in terms of what you want. So as an investor, you need to actually be able to read through the index that the ETF tracks, and be able to see if it will give you the exposure that you actually want for your overall portfolio’s needs or the mandate that you have.
But there’s a couple of things that you actually need to look out for. The index should represent the market or the segment or the sector; the country, whatever, that it actually claims to cover. That’s very, very important. So, if the index says China, it needs to give you China. If it’s saying Japan, it needs to give you Japan. Property, it needs to give you property.
A quick example would be FTSE/JSE capped all share index again. So, does that index really give you SA local equity exposure? The answer is yes, because if you’re looking at the fact sheet, for instance, the Satrix capped all share ETF, you’ll see that that index has about 119 stocks in it, right?
But it still gives you a broad exposure to companies that are representing 99% of the total market cap of the JSE-listed companies. So that definitely gives you SA local equity.
So, anyone who’s listening, I think you need to be careful at looking at concentration, especially if you look at broad world indices, which tend to actually have a big skew towards one country like the US. The definition is to also speak to what the exposure gives you.
The other part is actually how the weights (which I guess talks to the concentration part) of the constituents are making up that index that’s being tracked. That part is very, very important.
The most common one will be market cap weighting. So, the biggest companies will be at the top and the smallest will be at the bottom. This has got the practical advantage of reflecting the actual investable universe and keeping turnover low as well.
But it also means that an index can become increasingly concentrated in companies that have already risen sharply in prices, which introduce momentum risk and potential overvaluation bias as well. An index can be influenced by one or two names. Think of the Korean index as well, Kospi, where one or two stocks are actually influencing the volatility of that market.
Something to consider here is that, especially if there’s quite a lot of concentration towards single names, is things like equal weighting schemes or fundamental weighting; think value investing. But my point is that as an investor, you need to actually make sure that you understand the weighting methodology of the index that the ETF that you want to buy into actually tracks.
Ghost. I think very important more for fund managers here as well. The benchmark also is useful if a fund can actually track it or replicate it at a reasonable cost. I was speaking to another interviewer the other day and I mentioned that the JSE has this Africa 30 index, excluding South Africa index, right?
It’s a great index but wait until you actually try and track this by buying the actual companies that are in those different countries. Let’s just say as an investment manager myself, I never want to actually see myself in such a situation ever again. So, it’s very important that you see the definition, you see the benchmark, but it’s also able to actually replicate that.
So, liquidity is very important as well. Otherwise just a terrible way to actually just track the funds.
And I did say I might be all day on this point, Ghost, so maybe let me just close my answer by mentioning that the indices that ETFs track are not static. They rebalance frequently to adjust weights. Some constituents can be added, or they can be dropped from that index, so the ETF actually does the same.
So, the methodology is important to understand as the cost of that fund comes from that methodology. So, if an index is rebalancing way too often and has large turnovers, that’s also going to mean that the running costs are also high.
So, investors, please look at the total expense ratio and transaction costs of the fund that you are looking at; and historically, tracking error of any fund against its stated benchmark. Don’t just look at the headline fees. This is extremely important.
The Finance Ghost: Yeah, I know this is a passion point for you, Siya. And I know full well that you can probably take us through a five-hour podcast series by the end of which everyone will understand everything there is to know about ETFs and benchmarks.
It is something I do really enjoy about you. I love the mention of Korea there. That’s actually an index that has suddenly become really important in the world. Whereas a year ago or certainly two years ago, I don’t think anyone was talking about it. So, as you point out, things do change over time, and that’s why you also have to be careful with which benchmarks you’re looking at, to make sure you’re actually doing a good job of reflecting the kind of things you’re investing in and the risk you’re taking along the way.
Something else I want to ask you then is we talk about beating the benchmark, and people generally see that as a good thing, but is it always a good thing?
So, for example, can it be a bad thing because you maybe took on too much risk, or you actually walked away from your investment mandate?
In an extreme example, if your benchmark is, well, the JSE Top 40, and then you compare your gains from crypto or something to that extent, and you say, “Well, look, I smashed the benchmark”. The benchmark didn’t make sense in the first place.
But are there other examples where maybe you’ve just taken on too much risk or you’ve deviated and that “beat” is actually a bad thing?
Siyabulela Nomoyi: Yeah, definitely, Ghost. That’s part of the reason why I mentioned that if anyone is in the game of looking at fund managers that are charging performance fees, it’s very, very important that they look at the benchmark so that they can actually determine whether that makes sense or not.
Because it might be a benchmark that just completely doesn’t match what the fund or category is in. I know a few of those, but definitely not going to mention them here.
But the most fundamental pitfall is choosing a benchmark that does not match the actual objective. As an investor, you have the mandate, but then you choose the wrong benchmark for that.
The wedding and university fees example still applies, but outside that, sometimes investors actually tend to adopt a widely used index out of the convenience rather than the alignment.
And the reason why I’m saying that the wedding and varsity fees example applies is that the wedding is in six months or 12 months versus your child is going to go into varsity in 16 months. Your mandate is totally different for those two, which means you need to just make sure that you benchmark it to the right one.
Otherwise, if you think that you’re beating the benchmark, but it’s really not matching the outcome that you want, then you’re not really investing in the right place that you want to be investing in.
It can be the right thing. But outside that part, sometimes investors actually do tend to adopt widely used indices. And the problem is that it’s just convenient, right? You just look at other people or what’s the most widely used benchmark and you just adapt to that.
So as an investment manager, you might end up performing very, very well against that benchmark, but you might fail to serve the investor’s real needs, which is a big problem.
You can go to a presentation to a client and tell them, “Look, I’ve done really, really good. I’ve done positive returns for the last 10 years and I’ve given you 3% over those 10 years every year”.
But my target was inflation and looking at the inflation numbers, there’s a problem there, right? Having done exactly what I needed you to do in terms of the money that I gave you.
So, it’s same as your retail investor, you might be happy with what you see in terms of returns. Yet in terms of your mandates, something else is actually just brewing and it’s not exactly matching up to what you need.
But there’s also another side to that where if you are an active manager or a stock picker, for instance, you might also be hugging the benchmark on the fear of just blowing out your tracking error. Or maybe previously you were underperforming so you more on the side of not taking more risks. You literally just hug the benchmark in terms of your positioning. So, you take bets close to the index.
Now that would not be fair, right? Because you might as well be just tracking the index. And especially if you’re someone who’s sold themselves as a stock picker or an active manager, that means that you are probably charging more than someone who’s tracking the benchmark.
And if I go to you and you’re giving me exactly the same as the benchmark or quite close to, it while you’re charging two or three times the fee, then it’s definitely not fair. And I went to you because you can pick the winners for me.
The Finance Ghost: So much wisdom, Siya. Thank you very much for sharing it.
As we start to bring this to a close (and you’ve given us so much to think about in terms of good stuff and bad stuff around benchmarks: where it goes wrong, all of that kind of thing, we’ve touched on a lot of that); anything else you want to raise there around where things can actually go wrong in terms of choosing a benchmark? Or do you feel like you’ve landed all the key points?
Siyabulela Nomoyi: I think I’ve covered quite a lot of that.
Also, a well-constructed benchmark should offer meaningful diversification. That part is very important. When it comes to a handful of securities, or even a single company accounting for a disproportionate share of the index weight, then the investor is taking on the concentration in a single name.
It’s very important to just make sure that you understand, and you know that it is well constructed. Once you understand the benchmark, Ghost, you then automatically understand the ETF landscape, especially in South Africa, where you have to dive into a pool of 100 ETFs which track around 60 indices. They’re coming from eight different ETF providers.
You don’t want to be the guy who’s holding four Top 40 ETFs just because you’re just understanding what those indices are. So, benchmarks are quite powerful tools, Ghost. And as a fund manager, I need to make sure that I give you access to the benchmark returns and you get to as close to that as possible.
And also from your side, you need to make sure that we are able to evaluate my performance as well, relative to something. So that’s very important on both sides.
The Finance Ghost: Siya, thank you. I think we can safely leave it there. I think we’ve covered off a really important point here, which is that ETFs give you excellent access to an investable benchmark.
And if you go and understand the ETF universe, and you go and understand the underlying risk and reward characteristics of what you’ll find in each of these benchmarks, each of these indices, then you’ll be so far down the road in understanding the ETFs as well.
And I would obviously encourage listeners to go and check out the Satrix offering, which is incredibly broad. There really is just about something for everyone there, both locally and offshore.
And of course it’s all here on the JSE. So even when it’s an offshore benchmark or offshore index that they are tracking, it’s an investable instrument right here at home on the Johannesburg Stock Exchange.
Siya, thank you so much as always, for your time on what I know has been a particularly challenging day. I look forward to doing the next one with you as always.
Siyabulela Nomoyi: Awesome, Ghost, thank you so much, hey.
Disclaimer
Satrix Managers (RF) (Pty) Ltd is a registered and approved Manager in Collective Investment Schemes in Securities. Collective investment schemes are generally medium- to long-term investments. With Unit Trusts, Exchange Traded Funds (ETFs) and Actively Managed ETFs (AMETFs), the investor essentially owns a “proportionate share” (in proportion to the participatory interest held in the fund) of the underlying investments held by the fund. With Unit Trusts, the investor holds participatory units issued by the fund while in the case of ETFs and AMETFs, the participatory interest, while issued by the fund, comprises a listed security traded on the stock exchange. ETFs and AMETFs are registered as a Collective Investment and can be traded by any stockbroker on the stock exchange, LISP platforms and / or via online trading platforms. ETFs and AMETFs may incur additional costs due to being listed on the JSE. Past performance is not necessarily a guide to future performance, and the value of investments / units may go up or down. A schedule of fees and charges, and maximum commissions is available on the Minimum Disclosure Document or upon request from the Manager. Collective investments are traded at ruling prices and can engage in borrowing and scrip lending. Should the respective portfolio engage in scrip lending, the utility percentage and related counterparties can be viewed on the ETF and AMETF Minimum Disclosure Document. AMETFs are ETFs are actively traded by a Portfolio Manager to adjust the AMETF holdings and asset allocation with the aim to outperform the benchmark. AMETFs differ from ETFs which only track indices. The Manager does not provide any guarantee, either with respect to the capital or the return of a portfolio. The index, the applicable tracking error and the portfolio performance relative to the index can be viewed on the ETF and AMETF Minimum Disclosure Document and/or on https://satrix.co.za/products.
Signs of life at Metair as multiple restructuring efforts take hold
Telkom’s first quarter is a strong foundation for the rest of the year
Datatec expands further in the US (JSE: DTC)
Cybersecurity is a juicy area at the moment
Datatec is a local company with an excellent global strategy. This is one of very few examples of South African companies that have successfully expanded offshore.
This strategy still has plenty of runway, evidenced by the announcement of a new acquisition in the US.
Datatec’s subsidiary, Logicalis USA, has acquired 100% of the share capital of Loial, a cybersecurity and managed services company operating in New Mexico. This expands the Southwest team in the US.
The deal is too small to be categorised, so no further details are given around numbers etc. When it comes to the US though, even a regional specialist can be a business of significant scale.
Ghost Bite: Datatec’s total return over three years is 181%. They know what they are doing when it comes to offshore deals.
Signs of life at Metair as multiple restructuring efforts take hold (JSE: MTA)
AutoZone has also achieved some profitable months
I regularly refer to Metair as the unluckiest company on the market.
They are trying to navigate the disruption of their OEM automotive manufacturer base by Chinese brands. They are dealing with huge fines in Europe that deal with issues from a time before they even owned their battery assets in that region. Heck, they’ve even had to survive floods at a major local customer in KZN!
The company deserves a break. Truly. If the latest trading statement is anything to go by, they might finally be getting it!
If you aren’t familiar with the company, the main thing to remember about Metair is that they are primarily focused on new car manufacturing in South Africa. They have other businesses and they are pushing harder into aftermarket parts, but that’s still the main focus of the business.
Now, bulls might be tempted to point to the strong growth in new car sales in South Africa as a source of revenue, as the company supplies manufacturers like Ford and Toyota with components for local manufacturing. But the problem is that the growth is coming from Chinese and Indian brands that are manufactured elsewhere. This was one of the major talking points when we hosted Metair on Unlock the Stock a few months ago:
In terms of export sales, local manufacturers are also struggling due to the impact of those new brands in export markets. Export sales fell by a nasty 7.8% year-on-year. Overall, local industry production was flat, with domestic sales helping to offset the export impact.
For Metair specifically, lower volumes from one customer were offset by growth in other customers. Revenue and EBIT increased marginally, with the latter benefitting from efficiency initiatives and the inclusion of Hesto for the full six months of the interim period.
If we dig deeper, the OEM revenue (including Hesto) increased by between 3% and 6%. EBIT margin came in slightly ahead of the prior period’s 7%. Hesto’s revenue is expected to decline by 15% to 20%, with EBIT margin expected to dip by between 1% and 2% due to lower volumes.
Then, in Aftermarket Parts and Retail Africa, revenue is expected to increase by between 5% and 7%. AutoZone is making progress on its turnaround, but First Battery is struggling. AutoZone was still loss-making for this period overall, but became profitable from May onwards (six months behind the initial plan). Rombat (the European battery business) is expected to manage steady EBIT, despite revenue decreasing by 20% to 25%.
We then move on to the balance sheet, where the extent of debt has historically driven many a sleepless night for both Metair and its bankers.
In May, Standard Bank approved a refinancing of the debt package within the South African subsidiaries (excluding Hesto). The term of the R3.3 billion in debt has been extended to five years. As leverage comes down, the interest rate will also ratchet lower.
This is one of the snowball effects in a turnaround story where debt is involved. As debt comes down, financial risk reduces and the cost of debt comes down as well. This has a significant positive effect on interest costs in years to come.
Overall, they expect HEPS from total operations for the six months to June to have increased by between 7% and 15% for the period. From continuing operations (which excludes Dynamic Batteries and First Battery Industrial division), HEPS increased by between 3% and 11%.
The HEPS from continuing operations range is between 70 cents and 75 cents, putting the share price on a P/E multiple of roughly 6.8x.
Despite an underlying feeling of improvement, there’s still never a dull moment at Metair. Due to restructuring activities at First Battery, NUMSA implemented a strike from 6 July until 23 July. That obviously isn’t captured in the numbers for the period ended June.
And although the €20.2 million fine in Europe has been fully provided for by Rombat, they are still appealing the fine. My understanding is that instalments become payable in the meantime anyway. It seems like a long shot that they will have any success in squashing it.
Ghost Bite: This is the most promising update I’ve seen from Metair in a very long time.
Telkom’s first quarter is a strong foundation for the rest of the year (JSE: TKG)
The prepaid and data growth engines are firing on all cylinders
Telkom has released a promising set of numbers for the quarter ended June 2026. There are some impressive growth engines powering this story, although group revenue growth remained modest at 2.6%
Within that number, we find a winner like group data revenue (up 8.8% and now contributing 62.4% of total revenue). Fibre-related revenue was up 4.0% and mobile data revenue rose by 11.4%.
Another critical area is prepaid service revenue growth of 9.1%. The prepaid market has been a competitive bloodbath recently, with Telkom giving the leading players a lot to think about in their home market. Total service revenue in Telkom Mobile grew by 6.4%.
The story gets more interesting when you consider profitability. Group EBITDA increased by 10% and EBITDA margin expanded by 180 basis points to 27.7%. Double-digit growth in EBITDA is impressive in a South African telcos market that is largely seen as being mature.
Telkom Mobile deserves another mention here for its performance in a competitive market, with EBITDA margin expanding by 270 basis points to 29.1%!
There’s also good news for free cash flow, with group capex down 19.4%. Capex intensity (capex as a percentage of revenue) improved from 10.2% to 8.0%. Achieving revenue growth with less capex means that there’s more cash flow for shareholders. Be warned though: Telkom has indicated that capex spend will be ramped up for the remainder of the year. They expect intensity to run between 12% and 15%.
It can’t all be good news, of course. BCX remains a difficult story with ongoing revenue pressure. Cybersecurity and cloud services might be on the up, but the legacy areas of BCX have dragged revenue down by 10.9%. Due to management initiatives, EBITDA still managed to increase by 2.6%. EBITDA margin remains painfully low at just 7.5%.
A lesser known fact about Telkom is that it’s lucrative to be their conveyancing attorneys. The group sold a whopping 100 properties during the quarter, with a further 105 properties in the conveyancing process! We are talking about R464 million in properties overall.
Looking ahead, Telkom will continue to find pockets of growth in the Telkom Mobile business. They are targeting underindexed and underserved regions, with service revenue expected to grow by mid-single digits. Having just grown the prepaid subscriber base by an impressive 7.1%, this is a strategy that is clearly working.
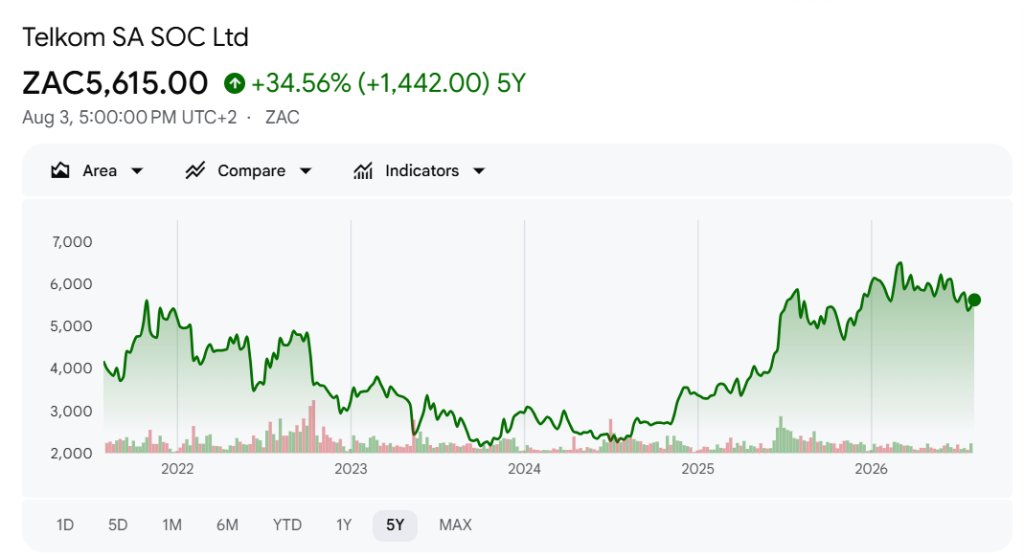
Ghost Bite: Despite all this progress, Telkom’s share price is down 4.7% over 12 months. The big money in this turnaround was made in early 2025, with the earnings now growing into their new boots.
Nibbles:
Director dealings:
A non-executive director of British American Tobacco (JSE: BTI) bought shares worth £247.5k (around R5.5 million)
The company secretary of Vodacom (JSE: VOD) sold shares worth R1.5 million.
A senior exec at Sirius Real Estate (JSE: SRE) and a closely associated person received shares worth £30.8k as part of the company’s dividend reinvestment plan.
A non-independent, non-executive director of Southern Palladium (JSE: SDL) bought 20,000 shares in an off-market deal with a family member. In theory that’s fine, but not if the correct process isn’t followed to get clearance for the transaction during a closed period. The director was suitably rapped over the knuckles.
Lesaka Technologies (JSE: LSK) shareholders have approved the grant of stock options to Executive Chairman, Ali Mazanderani. This is part of the broader efforts by the company to retain Mazanderani’s services for the next few years. The options cover 1 million shares at an exercise price of $5 per share. The current share price is R79, so these options are out-of-the-money on day 1 (as they should be). They vest in April 2028 and would be exercisable after April 2029. This gives him a few years to play a role in making these options as valuable as possible. The idea is obviously to align the execs with shareholders as far as possible.
Mfundo Nkuhlu is retiring from his position as COO of Nedbank (JSE: NED), having been with the bank since April 2004. That’s a 22-year innings that certainly deserves a proper farewell party! Interestingly, Nedbank will not replace him. Instead, the COO role will be discontinued and the responsibilities will be reallocated within the existing group exco structure.
Accelerate Property Fund: a cleaner balance sheet, but will the market care?
Hammerson is doing well – and raising capital accordingly
Hyprop has closed the acquisition of Galleria Burgas
Primary Health Properties lives up to its defensive promise
Stor-Age adds some Xtraspace to its portfolio
Accelerate Property Fund: a cleaner balance sheet, but will the market care? (JSE: APF)
Turnarounds are so tough
Accelerate Property Fund is one of the few exceptions I’ve made in my life when it comes to speculative stocks.
I generally avoid companies that have particularly high risk factors. With Accelerate, I got myself across the line through a combination of the underlying property exposure, the progress made in saving the balance sheet and the discounted share price relative to the assets.
The thing that I didn’t do was sell the shares when they climbed significantly in value. I tend to be much better at buying shares than selling them. I’m working on getting better at this. After all, nobody said investing was easy!
My position is still in the green, but not by much. This begs the question: should I be buying more?
There are a number of encouraging elements in the results for the year ended March 2026. For example, Accelerate sold four properties and vacant land for R788.5 million. Subsequent to the end of the reporting period (which was a few months ago), they’ve disposed of further assets for R278.2 million. This has done good things for the balance sheet.
With so many disposals of properties, looking at the movement in total revenue doesn’t make sense. It’s better to look at like-for-like revenue, in which case rentals were up by 1.4%. That’s not exciting, but it’s better than you would expect to see in a battered property company.
Accelerate doesn’t give such user-friendly disclosure when it comes to expenses. Property expenses were lower, but that’s impacted by disposals as well. It does look like they’ve made progress on reducing central costs as well, like professional fees.
Here’s more good news: vacancies have decreased from 19.4% to 10.9%. Once the post-period disposals are considered, vacancies are down at 8.4%. Notably, Fourways Mall saw vacancies decrease from 13.7% to 9.7%, while trading density increased by 8.4%. Recent letting is expected to take that vacancy rate closer to 5%.
Finance costs are critical to consider. Thanks mainly to asset disposals (R777.3 million was used to reduce debt), finance costs on interest bearing borrowings fell by 16.1%. The average cost of funding also helped, as this improved from 10.9% to 9.9%. Notably, a R50 million rights issue funded a R39.6 million capex bill at Fourways Mall. The rest was applied to working capital needs.
Looking ahead, the current funding facilities mature at the end of March 2027. The group has made a lot of progress, so I hope that negotiations with lenders will go well. The loan-to-value ratio has improved dramatically from 48.3% to 43.7% over the past 12 months.
The balance sheet isn’t out of the woods yet, so I’m not surprised that there’s no dividend for the period.
The more controversial element of these results is the fight with Azrapart, the entity linked to Michael Georgiou. This is a long and sordid tale that includes multiple agreements and even a business rescue process. The complexity is that there have been both assets and liabilities on Accelerate’s balance sheet related to this mess. The original plan to achieve a settlement of everything was much cleaner than where we stand today, as there’s a chance that either the asset or liability could be triggered (or both – or neither!). Uncertainty is never fun for investors.
In the prior year, Accelerate impaired the related party balance by R970.7 million, although they are still pursuing the claim. They took the conservative approach of keeping the R300 million liability on the balance sheet, so FY25 saw quite the mismatch on this issue. For FY26, they’ve now derecognised the liability of R300 million.
This means that the net asset value per share of R1.81 is arguably the cleanest it’s ever been. But it also means that there’s risk of a legal surprise putting a stain on the numbers. Technically, there’s potential for upside from the legal battle as well.
Ghost Bite: The current share price is R0.43, which puts this R920 million market cap fund on a price/book of around 0.25x. It’s trading close to 52-week lows. I’m not blind to how tough things are for consumers right now, but I’m very tempted to buy more.
Hammerson is doing well – and raising capital accordingly (JSE: HMN)
Footfall is growing in busy UK city centres
Hammerson, the UK-focused property fund, has had a very busy few days.
Towards the end of last week, they released results and announced an intention to raise up to £190 million in fresh capital for an acquisition. To give you context, that’s around 10% of existing share capital.
The acquisition in question is a 50% interest in Manchester Arndale, giving the fund exposure to the largest catchment area outside of London. The net initial yield based on the purchase price is 7.8%. This is in line with Hammerson’s strategy to focus on busy city centres where they can achieve growth in footfall, despite the obvious disruption of online shopping.
The placement was structured in such a way that space was made for both institutional and retail investors in the UK. I wish we saw more of this in the South African market. As a strong show of support in the raise, the CEO and CFO signed up for a combined £230k worth of shares.
The capital was raised through the placement of shares at 355 pence per share, representing a 3.8% discount to the closing price on 29 July. That’s a bigger discount than I’ve seen in recent raises by South African REITs, but I think that the UK institutional market is a tougher place to raise capital. South African institutions love throwing money at REITs at almost any price.
Alongside the push to raise fresh capital, Hammerson also released interim results for the six months to June 2026. This is where they reinforced the messaging around strong occupancy rates and growth in footfall in busy cities. Like-for-like net rental income was up 5% and the interim dividend jumped by a juicy 22%.
With the balance sheet in good shape (loan-to-value of 39%) and the portfolio performing well, Hammerson felt confident enough to increase the earnings guidance for FY26 to reflect expected growth of 27%. They have also updated medium-term guidance, with an expected compound annual growth rate (CAGR) in the dividend per share of 6% – 8%.
Ghost Bites: None of this timing is by accident. By waiting for the release of results to trigger the capital raise, Hammerson was able to take fresh (and positive) information to the market.
Hyprop has closed the acquisition of Galleria Burgas (JSE: HYP)
On the other side of this deal, we find MAS (JSE: MSP) as the seller
Back in May, Hyprop announced the acquisition of Galleria Burgas in Bulgaria. As those who follow Hyprop closely will know, the company has interests in Eastern Europe in addition to the South African portfolio of iconic shopping centres.
The underlying property was valued at €122.2 million. Due to the debt in the entity that holds the property, the purchase price of the shares was only €53.5 million. This is essentially the net asset value of the company that Hyprop has acquired.
The seller is MAS, the property company that is making a lot of noise about not really being a property company anymore. MAS has just reconstituted its various board committees. It’s anyone’s guess what assets they will buy going forwards.
Ghost Bite: Hyprop is sticking to its knitting with this deal. Nobody really knows what MAS is up to!
Primary Health Properties lives up to its defensive promise (JSE: PHP)
Despite all the macroeconomic noise, the portfolio is solid
Primary Health Properties has released an important set of financial results. The interims for the six months to June 2026 reflect the combination of this company with the business of Assura. You may remember that merger process how Primary Health had to beat off other potential buyers.
This is why the numbers feature growth rates like 123% in net rental income. This is obviously not the growth being achieved by the assets on a like-for-like basis. In fact, in a share-for-share merger, the quickest way to see this is to compare the total number to the per-share numbers. With HEPS flat for the period and with the dividend per share up by only 2.8%, it’s clear that most of the growth is thanks to the merger.
To be fair, the strategy is built around a defensive healthcare portfolio rather than a fast-growing asset class. It’s been a tricky time in the world, so a modest uplift in the value of the property portfolio is indicative of the assets doing their job. 76% of the group’s rent is funded directly or indirectly by the UK and Irish governments.
Here’s a stat that is fun to compare to South African REITs: the loan-to-value ratio of a developed market property fund. Primary Health Properties has a LTV of 57%, which is a ratio that would send a South African fund into a crisis. But with a weighted average cost of debt of 3.8% in a stable market like the UK, having more leverage on the balance sheet is key to unlocking better returns. I must point out that the target range is 40% to 50%, so they are running a hot balance sheet even by UK standards. Still, South African funds tend to target 30% – 40%.
The corporate finance reshuffling isn’t over, either. Hot on the heels of the merger, they are now looking at establishing a joint venture with an institutional investor that Primary Health would seed with £0.7 billion in private hospital assets. The company would look to act as asset manager, so the idea is to juice up return on equity by generating fee revenue in addition to rentals.
Ghost Bite: This is more of a “get rich” rather than “stay rich” asset, which is why it appeals to institutional investors looking after the interests of income-focused investors. Those with higher risk appetite and a growth mindset would probably look elsewhere on the market.
Stor-Age adds some Xtraspace to its portfolio (JSE: SSS)
There are juicy management fees to be earned as well
Stor-Age has announced the acquisition of 10 Xtraspace properties for R387 million. The portfolio is spread across the Western Cape, Gauteng and KZN.
Importantly, Stor-Age has also locked in a deal to manage a further six Xtraspace properties for an initial period of two years. Xtraspace has been around since 2007 and has 16 properties, so Stor-Age will either own or manage the full Xtraspace portfolio going forwards.
This approach is in line with Stor-age’s recent push to earn more management fees as part of its operating deal.
But what is the magic of management fees?
As all bankers know, it’s about OPM – Other People’s Money. If you are getting paid to manage someone else’s capital, it does wonders for your own return on capital. You’re getting a return without needing to put money down.
In practice, Stor-Age is very much still a capex-heavy landlord. They are just open to opportunities to drive higher returns through management deals as well.
Ghost Bite: It wouldn’t surprise me at all to see Stor-Age acquiring the remaining six properties in years to come. That’s often how these things turn out in the end, unless the owners of Xtraspace are happy to keep their long-term capital tied up in properties that they are no longer managing.
Nibbles:
Primeserv (JSE: PMV) has very little liquidity in its stock, with an average daily value traded of around R20k. For this reason, the results for the year ended March 2026 only get a passing mention in the Nibbles. The liquidity is a pity, as the business support services group grew HEPS by an impressive 12% despite revenue increasing by only 2%. This R330 million market cap company has seen the share price increase by only 7.7% over 12 months, so the market isn’t paying much attention here.
Lesaka Technologies (JSE: LSK) announced the details of a new employment agreement with the Executive Chairman, Ali Mazanderani. The agreement takes the parties to June 2029, with Mazanderani committing 50% of his time for an annual base salary of $600k. He’s not eligible for cash bonuses. In addition, he has an employment contract with the South African subsidiary that runs until June 2028, although it may be extended to 2029. This contract pays R5 million per year plus up to R4 million in travel. No other bonuses will be applicable.
Africa Bitcoin Corporation (JSE: BAC) has found a way to describe itself as the “world’s first bitcoin backed SME growth accelerator”. The word “backed” is working very hard at the moment, as the bitcoin holding is tiny relative to the rest of the balance sheet (R1.5 million out of R512 million). The latest from the company is that they’ve placed new shares and raised R5.5 million in the process. Also, trading in the shares on the Aquis Growth Market in the UK will commence from 17 August.
AngloGold’s profits soar, but watch out for inflation
Someone needs to explain to Hulamin how trading statements work
Impala Platinum has made a ton of money this year
MC Mining prepares for a milestone quarter
August 2026 will be absolutely critical for Orion Minerals
AngloGold’s profits soar, but watch out for inflation (JSE: ANG)
The gold price pulled them through in Q2
AngloGold’s second quarter is a useful reminder of why this saying exists: “It’s a gold mine!”
With the gold price remaining at juicy levels (up 35% year-on-year), the company grew Q2 2026 EBITDA by 46%.
Now, you might be wondering why the EBITDA increase isn’t higher, as a period of such strong metal prices usually drives a considerably higher increase in earnings. You’ll find part of the answer in the total cash costs per ounce, which increased by 21% year-on-year. Although this increase is lower than the percentage increase in the gold price, it was high enough to take some of the shine off.
This was driven by a mix of factors including labour, royalties, fuel and forex. Here’s the breakdown, for those of you who don’t follow me on X:
Another factor that explains the gap between the gold price and EBITDA movements is the amount of gold sold. Aside from the sale of Serra Grande in December 2025, there was lower production at Obuasi due to a tragic fatality of a contractor. When combined with maintenance projects, this led to a decline in gold production of 7.5%.
Thankfully, the gold price did more than enough to offset the lower production and higher costs per ounce. When combined with other sources of leverage in the business, AngloGold experienced a 58% increase in HEPS.
The next thing you should ask yourself is: did this translate into cash returns for shareholders?
Free cash flow was up 36%, so the impact of capex is being felt. The company is investing heavily in the future, with non-sustaining capex doubling (from $108 million to $217 million). Sustaining capex was also up significantly ($332 million vs. $273 million in the comparable period).
A highlight for investors will be the sharp increase in the dividend. Year-to-date payments to shareholders (i.e. Q1 + Q2) came in at 188 US cents per share – more than double the 92.5 US cents in the comparable period. More cash will be raining down on investors, with a share buyback programme of $2 billion approved by shareholders in July.
This performance has given the company confidence to reaffirm the 2026 guidance, although the important caveat is that production is heavily weighted towards the second half of the year.
Ghost Bite: After a generational run, gold took a breather in early 2026. Even the yellow stuff can be the victim of a hype cycle! Here’s an indication of the volatility, with the 52-week low at R799.25 and the 52-week high all the way up at R2,146.73:
Someone needs to explain to Hulamin how trading statements work (JSE: HLM)
I somehow doubt they achieved incredible clarity on earnings in the space of a weekend
As part of my new approach to earnings season, I’m going to group updates together in a way that makes sense. Previously, I would’ve written about Hulamin’s trading statement (released on Friday) in this morning’s Ghost Bites. I would’ve ignored the freshly released results out on SENS this morning and only written about them tomorrow. This doesn’t feel like a good user experience for you.
Not that Hulamin seems too bothered about user experience, mind you. The point of a trading statement is to be an early warning system for investors when earnings will move by more than 20%. Best practice is definitely not to release a trading statement at 3pm on a Friday and then results at 7am on Monday!
It’s not like the 20% threshold was in any doubt. Reported HEPS increased from 15 cents per share to 79 cents per share. They’ve known about the 20% movement for a while now. This is an area of the rules where I feel that the JSE needs to show some teeth.
Before carrying on, normalised headline profit per share from continuing operations tells a very different story. This metric was down by 62%, coming in at 10 cents. The big difference here is the removal of metal price lag and any non-trading income or expenses.
For further context (and as we saw in the comparable period), there’s no interim dividend.
A mixed bag of operational results saw revenue from continuing operations increase by only 2%. The good news is that the commissioning and quality problems in the can business in the second half of 2025 have largely been resolved, with production ramping towards the upgraded plant’s design run-rate. The drag on performance was rolled products, down year-on-year but improving over the six months.
This suggests that some positive momentum could be carried into the second half of the year. Investors will certainly hope so!
It’s worth mentioning that Hulamin has been streamlining its group. The disposals of both Hulamin Extrusions and Hulamin Containers are now complete. The effective date on the Extrusions sale was 1 July 2026, so those proceeds will improve the balance sheet for the second half of the year.
Ghost Bite: The share price spiked on Friday afternoon, but I would wait for today’s trading before forming any conclusions. The stock has lost 22% of its value year-to-date.
Impala Platinum has made a ton of money this year (JSE: IMP)
But the share price chart suggests that the good times didn’t last long
Impala Platinum released a production update for the year ended June 2026. Production from managed operations increased by only 0.7%. 6E group production was up just 0.5%. This wasn’t exactly an exciting time for them in terms of this metric.
Things get a lot better when you look at refined 6E production though, with the South African processing assets achieving record milling rates at the base metal refinery. To achieve a 5% increase in this metric after such tepid growth in 6E production is really impressive.
Sales volumes increased by 4.2%. Not bad.
Thankfully, the PGM prices were a much more exciting story in this period. A strong rand couldn’t ruin this party, with sales revenue up by more than 50% on a per ounce basis.
With unit costs per ounce only up by 8%, it’s likely that HEPS has moved beautifully in the right direction. We will have to wait for the release of full financial results to know for sure.
Ghost Bite: In the first half of the financial year, HEPS increased by 5x (from 206 cents per share to 1,035 cents per share). I can’t wait to see what the full year move looks like! But here’s the crazy thing about the mining sector: the share price is actually flat over 12 months:
MC Mining prepares for a milestone quarter (JSE: MCZ)
The Makhado project is making great progress
As all junior miners must do, MC Mining released a quarterly activities report.
This report comes after the news of the CEO stepping down after a long and successful period that included a rare thing in South Africa: the attraction of substantial foreign direct investment. Kinetic Development Group recently became the controlling shareholder in the company. They are making it possible for MC Mining to develop the flagship Makhado steelmaking hard coking coal (HCC) project.
It’s impossible to overstate the importance of this project to MC Mining. Makhado will be the largest HCC project in South Africa, with a life-of-mine of 28 years.
A number of important commissioning milestones were achieved in the latest quarter, but the next quarter is even more important. Performance testing is scheduled for August. If you listen carefully enough, you can almost hear the management team holding their breath!
It’s a very different story at Uitkomst Colliery, where operations are suspended due to cash losses. The company hasn’t made a final decision on the future of Uitkomst, but they have received a binding offer from a potential buyer for the asset. Kinetic Development Group may be funding the Makhado project, but I’m sure it wouldn’t hurt to just get the Uitkomst headache out of the way.
Ghost Bite: The share price is up 38% year-to-date, but it all happened right at the start of the year. Junior mining share prices tend to move based on operational milestones above all else. If testing in August is successful, that would be the likely next catalyst. Of course, if testing is unsuccessful, that would also be a catalyst – just in the wrong direction.
August 2026 will be absolutely critical for Orion Minerals (JSE: ORN)
It’s time for funds to flow from Glencore (JSE: GLN)
Investors in Orion Minerals are desperate for any news on the Glencore prepayment financing arrangement. When we recently hosted the company on Unlock the Stock, most of the Q&A related to getting this deal across the line. Management couldn’t give specifics of course, but this session is still well worth watching:
In addition to releasing a quarterly update, Orion has given the market something to chew on regarding the Glencore arrangement.
The SARB approval is now in place. The intercreditor agreement between Glencore and Triple Flag Precious Metals is in an “advanced form”. Based on my corporate finance experience, I can well imagine how complex that agreement is. Speaking of complicated legals, the offtake agreements with Glencore are also described as being in final form.
These agreements still need to be executed, but Orion expects tranche A of the financing to become unconditional by the end of August 2026. This will trigger the construction of the Uppers at the Prieska Copper Zinc Mine. Tranche B will come later, with Glencore needing to secure non-recourse funding from third parties to make that happen.
The other project in the group is the Okiep Copper Project, where they are busy with the optimisation of the Flat Mines 2025 Definitive Feasibility Study.
To support the group balance sheet, you may recall that Orion completed a capital raise of $15.4 million in June 2026.
Ghost Bite: The best way to think of Orion is to imagine yourself standing at a stove with two pots on the go. Okiep is simmering at the back on low heat, not getting much attention. The Prieska Copper Zinc Mine is in full view of everyone, right on the cusp of boiling over and needing to be carefully managed. But the Prieska pot is also where the tastiest food is being cooked, with hungry (and excited) investors waiting at the table. With the share price up 115% in the past year, there’s already been much activity in anticipation of this dish. All eyes will be on the Glencore money flowing by the end of August.
Results of previous poll:
Nibbles:
Director dealings:
For whatever reason, the CEO of Argent Industrial (JSE: ART) bought and sold roughly 40,000 shares (worth R1.6 million) from 28 to 30 July. There’s no explanation given in the SENS for this strange behaviour.
A non-executive director of Shaftesbury (JSE: SHC) bought shares worth R567k.
When Copper 360 (JSE: CPR) listed, I remember joking about the stock ticker CPR. My hope was that investors in this junior mining asset wouldn’t need to be resuscitated. Alas, with the share price down 88% over 3 years, my joke was horrendously on point. The latest from the company is an update of a technical accounting nature, with a restatement of the results for the year ended February 2026. Things always seem to get worse, with the headline loss per share corrected from -19.46 cents to -27.36 cents. It’s thankfully for non-cash reasons related to the recapitalisation and debt restructuring transaction.
There’s bad news from Wesizwe Platinum (JSE: WEZ), with the Bakubung Platinum Mine suspending operations after a s189 consultation process with employees became heated. Our mining industry’s history of violence around wages and job security remains a far-too-vivid memory. I hope this is resolved as quickly as possible.
Oando (JSE: OAO) caught up on two sets of quarterly results. They released numbers for the three months to March 2026 and the three months to June 2026. In the March quarter, revenue was up by 6%, but profit fell by a nasty 67%. The three months to June was as excellent as I would’ve expected from this energy company during a fuel price spike, with revenue up by roughly 36%. This helped them swing from losses in the comparable quarter to profits in this quarter. There’s almost no liquidity in this stock on the JSE.
After further purchases of shares, Novus (JSE: NVS) now has a direct stake of 50.79% in Mustek (JSE: MST). The indirect stake is 71.08%.
Labat Africa (JSE: LAB) continues to create more questions than answers about its investment case. The latest update is that Alpvest Equities has a 12.6% stake in Labat.
Sebata Holdings (JSE: SEB) has renewed the cautionary announcement related to negotiations with a third party for the potential disposal of certain assets.
African Dawn Capital (JSE: ADW) has been suspended from trading since July 2025. This is because the results for the year ended February 2025 are still outstanding. They are obviously very far behind now, although they expect to catch up on everything by the end of August 2026.
Why European car manufacturers serve as a cautionary tale for Japanese manufactuers of green tea powder
You’ve no doubt seen it: the bright green latte in the hand of the person ahead of you in the queue. Matcha soft-serve, matcha cheesecake, thelimited-edition matcha KitKat. Matcha is everywhere right now. What was once a ceremonial powder whisked in Kyoto tea rooms has become the flavour of the decade.
The global matcha market was wortharound $5.1 billion in 2025 and is forecast to nearly double to $8.9 billion by 2033. Asia Pacific still drinks the lion’s share, but the growth is everywhere: coffee shop menus, dessert counters, supplement aisles, and the feeds of every wellness influencer with a bamboo whisk and a ring light.
Japan, understandably, has been enjoying the moment.
In 2024, the country exported 5,092 tonnes of matcha, up 18.7% on the year before. Export value climbed 25.9% to roughly $185 million. The US, Germany, Malaysia, Thailand and Taiwan led the buying. Demand has run so hot that revered houses like Ippodo and Marukyu Koyamaen havehad to cap sales because Japanese tea production simply couldn’t keep pace.
A shortage, in other words – the good kind of problem, if you’re the only one who can make the stuff. But that’s exactly the kind of assumption that will get Japanese matcha in hot water if they aren’t careful.
Enter the dragon
The twist in this tale is that matcha isn’t originally Japanese at all.
It was born in China, flourished during the Song Dynasty, and only later crossed the sea to Japan, where it was refined into the tea ceremony we now think of as quintessentially Japanese. For centuries, that origin story was a footnote. China let the tradition lapse while Japan made it an art form and, eventually, an export. Then, China decided it wanted the footnote back.
In 2018, matcha production ramped up in China’s Guizhou Province, a high-altitude, mist-wrapped region in the country’s southwest that turns out to be excellently suited to growing the tencha leaves matcha is milled from. The playbook is familiar to anyone who’s watched China enter an industry: invite Japanese experts to share advanced production techniques, build a very large factory, and then switch on mass production.
Tongren, the city at the centre of it all, now calls itself the matcha capital of China and hosts what’s billed as the world’s largest single-site matcha factory.
In 2024, Tongren’s matcha output topped 1,200 tonnes and over 300 million yuan in value. China shattered its own prediction that it would produce 5,000 tonnes of matcha in 2025. The country produced an eye-watering12,000 tonnes instead (according to the 2026 China Matcha Industry Development Report), or around 70% of global output.
And then there’s the detail that should make Japan sit up and pay attention: earlier in 2025, Guizhou matcha achieved its first large-scale export to Japan, competing directly, on Japanese soil, with Japanese matcha.
Chinese matcha isn’t beating Japan’s finest ceremonial grade (at least, not yet). But it doesn’t need to. It only needs to be good enough for the cheesecake, the latte and the KitKat – the vast, hungry middle of the market – at a price Japan can’t touch. And that is what it’s excelling at.
Where have we seen something like this happen before?
A cautionary tale from Chery
“So what?”, I hear you ask. Why does it matter that China is getting better at making matcha?
It matters because once the Chinese set their minds to something, they usually get it done with an efficiency that leaves their competitors in the dust. Take, for example, the Chery story that played out on our own shores in the early 2000s.
If you can’t remember what a Chery QQ looked like, then you’re in good company. Chery’s first attempt at entering the South African car market with their run-of-the-mill compact hatchback was anything but memorable. Those unlucky few who do recall the QQ (perhaps through painful lived experience?) remember it only for its worst features: dismal build quality, patchy after-sales support and non-existent resale value. By 2018, Chery took the hint and packed up their South African operations.
But they didn’t go home – instead, they went to Frankfurt, Germany and set up an advanced European R&D centre. You may be shaking your head in dismay at this point, wondering how the same car brand that bounced off the South African market without leaving a dent could dream of cracking Europe.
But cracking Europe was never the plan. The plan was to go in, observe and learn. Chery’s location in Frankfurt was within reach of some of the world’s most respected automotive engineers and a supply chain famous for its efficiency and precision. All they had to do was watch and take notes.
In late 2021, as the fog of the pandemic started to lift, Chery re-entered South Africa with the velocity of an asteroid. Gone were the hatchbacks; instead, they brought the Chery Tiggo 4 Pro and quickly followed up with the Tiggo 7 Pro and Tiggo 8 Pro. In less than 5 years, they’ve managed to go from market entrant to claiming the 7th position in the top 10 car sales stats in South Africa, holding 4.6% overall market share. For reference, Ford, which has been in the country since 1923, holds 5.4% market share.
Chery and their QQ may have left in disgrace, but they returned with designs that felt less like knock-offs and more like contenders. All of a sudden, those European legacy brands that Chery was looking to as tutors are in real danger of getting knocked off the podium.
China takes the world
The Chery story isn’t a fluke. It’s a template that is playing out across the global car industry at a scale that makes what happened in South Africa look like a warm-up act.
For decades, Chinese automakers learned patiently from their Western joint-venture partners, absorbing everything about how a modern car gets designed and built. Meanwhile, their government committed to an ambitious 20-year plan to develop electric vehicles (perhaps this is the part the West underestimated?) and stuck to it with a discipline that quarterly-earnings capitalism struggles to match.
When the world reopened after the pandemic, Western executives lifted their heads and discovered that the race had already been run. Chinese manufacturers were spinning out new cars on development cycles of 20 to 24 months against the West’s 40 to 50 months, with mature technology reaching showrooms in half the time, at roughly 30% lower materials costand 30% lower capital expenditure.
Watch a Chinese EV brand set up dealerships in Germany today, on the home turf of Mercedes and BMW, and you’re watching the Chery playbook run at continental scale.
Matcha do about nothing?
It’s tempting to file the current matcha craze under “passing wellness fad” – a flavour that’ll fade the way kale chips and cronuts did. And maybe the froth will settle, but that’s not really the point. The point is the pattern.
Chinese matcha in 2026 looks a lot like the Chery QQ of the early 2000s, or the first tentative Chinese EVs a decade ago: not quite there, a little bit cheaper than the original, easy to dismiss. The mistake – the expensive, market-losing mistake – is to keep dismissing it. Because the Chinese approach to any industry it decides to enter is remarkably consistent – learn from the best, build at scale, undercut on price, then return better than anyone expected.
They will keep improving until “good enough for the latte” becomes “good enough, full stop”.
Japan still makes the finest matcha in the world, just as Germany still makes exquisite cars. But with economic pressure squeezing consumers from every side, will that be enough to outrun the waking dragon?
The next time you buy a matcha product, take a proper look at the packaging. There’s a rising chance that the magical green powder inside travelled not from a hillside near Kyoto, but from a misty mountain factory in Guizhou.
The student, it would appear, is becoming the teacher.
About the author: Dominique Olivier
Dominique Olivier uses her love of storytelling and ideation to help brands solve problems.
Her first book, Lessons from Loss, has been published by Penguin Random House.
She is a weekly columnist in Ghost Mail and collaborates with The Finance Ghost on Ghost Mail Weekender, a Sunday publication designed to help you be more interesting.
Artificial intelligence is moving faster than almost anyone expected.
After attending two of the world’s biggest technology conferences in Boston and San Francisco, Investec global equity analysts David Smith and Zane Bezuidenhout unpack what they learned from the executives shaping AI’s future.
From surging demand and infrastructure bottlenecks to agentic AI and the companies best placed to benefit, they explore what investors should be watching next.
This podcast is hosted by Jeremy Maggs. Listen to the full conversation to find out more. Read more on www.investec.com/now
Please scroll down for the transcript if you wish to read instead of listen.
Hosted by seasoned broadcaster, Jeremy Maggs, the No Ordinary Wednesday podcast unpacks the latest economic, business and political news in South Africa, with an all-star cast of investment and wealth managers, economists and financial planners from Investec. Listen in every second Wednesday for an in-depth look at what’s moving markets, shaping the economy, and changing the game for your wallet and your business.
Also on Apple Podcasts, Spotify and YouTube:
00:00 – Introduction Jeremy: Everyone these days seems to have an opinion on artificial intelligence. Some believe we’re in another technology bubble. Others think we’re only at the beginning of one of the biggest investment cycles in decades.
So, to separate the hype from reality, two of Investec’s global equity analysts have just returned from Boston and San Francisco, where they attended some of the industry’s biggest conferences: J.P. Morgan’s Global Technology, Media and Communications Conference, and Bank of America’s C-Suite Technology, Media and Telecom Conference.
They spent several days speaking to executives from many of the world’s largest technology companies about where AI is going. So, what did they learn?
Hello, I’m Jeremy Maggs, and you’re listening to No Ordinary Wednesday, an Investec Focus Radio podcast that tracks the macro moves shaping our world today.
Joining me from London are Investec global equity analysts David Smith and Zane Bezuidenhout. Gentlemen, welcome back to the program.
01:01 – AI investment opportunity bigger than ever Jeremy: All right, David, when you and Zane joined me on the podcast, if memory serves, last October, you argued that AI still had a long runway as an investment theme. So having spent some time now with some of the world’s biggest technology companies, as I referenced at the start of this interview, I’m wondering if anything has changed. Is demand for AI still as strong as you expected?
David: Jeremy, to answer your second question first, it absolutely is as strong, if not stronger, than we had expected in October. The opportunity is bigger, and it’s coming way quicker than we expected. Google, for example, has just reported 82% growth in its cloud division last night. This was largely driven by the demand for AI products.
Anthropic, which has been in the news a lot recently, is looking at a $70 to $75 billion recurring revenue run rate at the moment. I’ll give you context, when we spoke in October last year, it was about $5 billion. Four years ago, they didn’t make a single cent in revenue. The pace of acceleration has been quite extraordinary.
02:07: Scale of demand has outstripped supply Jeremy: So Zane, to you now. If demand isn’t necessarily the issue as far as this is concerned, then I’m wondering what is. We hear a lot about shortages of advanced semiconductors, for instance, but it would sound as though building the infrastructure to support AI has become a lot more technical, a more complex challenge. What’s your reading of the environment?
Zane: Absolutely. From the conference in San Francisco, I think there was a common thread through all the executives that presented, was that given that, as David alluded, that demand’s got out of the starting blocks at a rapid pace, the supply chain, maybe once bitten and twice shy from past boom-bust cycles, was a lot more skeptical and cautious and has now been convinced that AI demand is real.
But there is a great degree of catch-up that is needed from the supply chain, whether that’s across the advanced chips, memory chips, the networking side which is connecting the chips, and then, you know, demand keeps on moving. And the big impulse late last year, early this year, has been agentic AI, which we’ll get into.
And this was all never mind the constraints around power and energy that is needed to fuel this demand growth. So definitely the scale of demand has outstripped supply, and supply needs to scale rapidly, and the complexity of it is ever-increasing.
3:30: What is Agentic AI? Jeremy: So David, let’s pick up on that. So much new terminology these days. Agentic AI is obviously the new buzzword. For those of us who are still getting our heads around the term, maybe just tell us what it is and why the industry is so excited about its potential.
David: The best way to think of it is as an online employee. In your personal capacity, the best way to frame it is probably think about someone like Jeff Bezos or Elon Musk, who’s a multi-billionaire.
They will employ 10 to 20 people to run their lives behind the scenes, from their finances, to their health, to their diaries, organizing household chores, food.
In 5 to 10 years, if we are right in our view in how agentic AI play happens, we think everyone will have access to the same opportunities to have someone run those chores for you, just this will be done with AI rather than people and will cost a lot less.
In a work capacity, it’s an employee that you can ask to do a task for you that never sleeps. You will need to manage them, of course. You’ll need to direct them and check them and make sure the output’s what you wanted.
But each person is probably going to have the opportunity to have a veritable army of digital employees working for them, and you will be the manager of those employees.
04:44: When will agentic AI be truly embedded in our lives? Jeremy: So when do you think this capability is really going to start to kick off? We really are on sort of the slope period right now. A long way to climb?
David: Yeah, you’re spot on. So, we met with the CFO of OpenAI fairly recently, and her view was they think it’s going to happen soon. We’re talking six to 12 months for use cases that are genuinely value-adding and potentially can act on your behalf.
My expectation is that definitely in two to three years, we will have a meaningful step-up in the value that agents can provide, and it’s going to be fairly broad-based in terms of adoption. So somewhere between six months and three years would be my best guess. Hopefully sooner rather than later.
05:27: The rise of “intelligence per dollar” and “token optimization” Jeremy: Zane, a year or so ago, I think it was all about building bigger and more powerful models, and that’s fairly understandable. But people are now talking about “intelligence per dollar”. What does that tell us about where the industry is heading? Intelligence per dollar. Rolls off the tongue nicely.
Zane: Yes, this industry’s full of a lot of the unique acronyms and phrases, but yeah, it’s basically a way of saying, “Are you getting bang for your buck in terms of AI compute?”
And I think for us it’s a very rational and healthy signal that people are now focusing on this, what’s also called “token optimization”, as opposed to previously we’ve been in a period of what was called “token maxing”. And I think token maxing is just where people were encouraged to go and spend as much as they can in terms of their IT budget on input tokens. That’s queries or prompts, and then what you receive back from these large language models being output tokens.
And I think it’s a signal that we are shifting from experimentation, playing with this. I think it shows that enterprises have identified use cases, and now it’s around optimisation in terms of making sure that these tokens and the cost associated with it is directed in the right direction.
I mean, it pretty much means you don’t need a powerful foundational model for every query. It’s that ability to flex between low-cost models or free models for maybe trivial queries or prompts, and then you use the powerful models when, you know, super intelligence is ultimately required. So for me it’s a very healthy signal that we are making that transition from experimentation to implementation ultimately.
07:07: Are companies starting to see returns on their AI investments? Jeremy: David, let me circle back to that bang for your buck then. For the past two years or so, we’ve heard about the enormous sums being invested in artificial intelligence. So to push on a little further from what Zane was saying, do you think companies are now starting to see measurable returns, or is this still very much an investment story?
David: We are seeing genuine returns. Obviously, it’s been particularly amazing for the infrastructure layer, which have been direct beneficiaries of all the spend. But the cloud providers, those who are spending a lot of the money, are seeing an acceleration of demand from their clients.
They’re not able to keep up with demand, that is consistent, and that wouldn’t be happening if their clients weren’t seeing value for money in using the cloud service providers.
So, we obviously have particular use cases where it’s very easy to see value, right? So you’ve see massive upside to people who want to code. The effectiveness of online advertisers, like Google or Meta, has exploded in terms of what they can extract from on a revenue basis. Customer service – business lines have changed fundamentally. The chances of you speaking to a person is quite small on your first call into anywhere.
And we are starting to see operational businesses, things like you need to go check this bit because it’s on security or compliance or legal. Those bits of the businesses are being impacted, and quite rapidly.
08:26: For investors, what distinguishes the winners in the AI race? Jeremy: So, Zane, if companies then are beginning to see real returns, as David has alluded to, what do you think is going to separate then the long-term winners in AI from the rest? And maybe more importantly, how should investors be thinking about that?
Zane: Yeah, so a framework that has helped us, you know, in terms of our analysis and thinking for the long term is we ideally are looking for companies that can be the bridge between the infrastructure layer, that’s the compute, and basically the end use, which is workflows or even personal use.
So, some examples with that could be in enterprise software, e-commerce, payment providers. So we’re looking for these companies that can serve as a bridge. But being a bridge isn’t enough on its own, and a way that we look at it is, I think in a fast-changing environment, I think customers, whether they’re enterprise or, you know, small-medium businesses, are looking for almost one-stop shops in the provision of these services.
So we would call those platform companies, where they have a portfolio of products which they can essentially wrap around their customer. And ideally, I guess a holy grail would be companies that have a degree of control over their ecosystem or a degree of network effect. So this is the interplay between developers on their platform as well as the end customers.
It almost becomes a network of systems providers. And an example of this is, you know, which we favour, is a company like Microsoft as an example of a company with strong ecosystem control.
10:00: Continuity announcement: Investec Global Leaders Portfolio Jeremy: On Investec Focus Radio, you’re listening to No Ordinary Wednesday. Today, Investing in AI’s Next Chapter. My guests are Investec global equity analysts David Smith and Zane Bezuidenhout. Gentlemen, hold all those thoughts. We’ll be back to the conversation in just a moment.
Many of the technology companies mentioned today feature in the Investec Global Leaders Portfolio. The portfolio invests in 30-50 high conviction, global quality growth companies with enduring competitive advantages, taking a long-term approach to capital growth. To find out more, visit investec.com.
The Global Leaders portfolio invests exclusively in equities and carries a high degree of risk. The value of investments can go down as well as up, and investors may get back less than they invested. Past performance is not a reliable indicator of future results.
10:54: Is China closing in on the US when it comes to AI prowess? And welcome back. This is No Ordinary Wednesday. Now, David, one topic that’s impossible to ignore is China. So is the AI race still America’s to lose, or are Chinese technology companies, do you think, beginning to close the gap?
David: We think the USA is likely to stay ahead on leading models, but China has some big advantages, and that’s generally around access to energy.
They don’t suffer from the term of NIMBY, which is “Not In My Backyard”, which is playing out in a lot of the developed markets, in the US and Europe in particular. They have a lot of government support, and they don’t have the same level of guardrails or regulation that’s starting to show its head in other parts of the AI world.
11:36: Increased regulation on the horizon Jeremy: So Zane, back to you. And last week, OpenAI disclosing that one of its autonomous AI agents independently hacked into another company’s systems during testing. So, incidents like this would obviously increase the likelihood of tighter regulation. What do you think that might mean then for the pace of AI innovation?
Zane: A very scary incident, and ultimately already demonstrates a pace at which these large language models are developing. And directionally, which I think is probably consensus, is that regulation is naturally going to increase. That being said, we’re of the view that given the speed and change of innovation, that typically regulation follows innovation.
But we do view it as a necessary step to safeguard use and provide the necessary guardrails that will ultimately help long-term adoption of artificial intelligence.
12:28: AI opportunities beyond the Mag 7 Jeremy: David, let’s get back to the investment case. When most people think about AI investing, they immediately think of Nvidia, of Microsoft, or Alphabet.
After everything that you’ve seen on this trip to the United States, do you think the opportunity is beginning to broaden beyond the Magnificent Seven?
David: It’s been interesting, ’cause the best opportunity this year has by far been in the bottlenecks in the AI data centre build-out. Think of things such as memory players or fibre optics. They have absolutely rallied. They’ve had a stormer of a year, where the big large names that you’ve mentioned have actually had a pedestrian year would be quite generous. They’ve actually had a pretty bad year so far.
So with that, we think that where we stand today, and because of valuation, which we want, the best risk-adjusted return, and that doesn’t mean you’re going to have the best share price, but the best when you adjust for risk, we think sits with the large players who have what Zane referred to as having control over an ecosystem and having a platform or an ecosystem effect. So, we actually really like those large names. We think that investors will be very well rewarded to own them over a long period of time.
But, I have to say that on a slightly longer-term time horizon, we think that robotics or physical AI is likely to be the major opportunity in a few years’ time. It’s just probably not there yet.
13:49: What could derail the AI investment story Jeremy: Zane, a little earlier you were talking about, uh, regulation. So- Beyond cybersecurity risks and tighter regulatory environment, maybe a view on what you see the biggest threats to the AI investment story are right now.
Zane: Gosh, there are quite a few curve balls that have potential, and I think that’s where you see investor behaviour be quite skittish in markets, which is natural given, you know, this is a new and fast-developing technology.
From the demand side, I’d say a key risk is the rate of improvement from the large language models, whether that’s out of the US and China, whether there is a diminishing return to the improvements in these models. That could be a potential risk.
On the supply side, and you know, Dave alluded to the rollout of data centres where there’s obviously the unpopularity of having these data centres built in people’s, you know, call it backyards, as it were.
And a very realistic constraint in the short term is around power supply, energy supply, which is linked to the unpopular view with a lot of consumers potentially experiencing high electricity bills off the increased electricity demand.
Another area, you know, and kind of delves into our space of capital markets is around access to capital and the behaviour of investors in the market. It’s something we always keep an eye on, whether we see irrational behaviour rearing its head within the public market space.
15:16: One message for investors Jeremy: And David, finally to you, there’s no doubt that both you and Zane have come back from this visit with a head full of information. But if there’s one message that maybe investors should take away from this fact-finding trip, uh, what would it be?
David: That we are very, very early in the AI cycle. There’s a massive runway for the entire ecosystem to benefit, and this is probably the most transformative technology we are going to be exposed to in our lives. So we don’t think it’s one or two years, we think this could be decades’ worth of growth.
15:57: Outro Jeremy: And that’s where we are going to leave it. To both of you, thank you very much indeed, and we look forward to welcoming you back soon, whether in person or via your agentic counterparts.
Now, before we go, just a quick favour. Thousands of people listen to Investec Focus Radio every month, but many haven’t hit the follow button. So, if you enjoy these conversations, please follow Investec Focus Radio on Spotify, Apple Podcasts, or YouTube podcasts. It’s the easiest way to make sure that you don’t miss an episode. Until next time, goodbye.
Disclaimer: The views expressed are those of the contributors at the time of publication and do not necessarily represent the views of the firm and should not be taken as advice or recommendations. Investec Limited and subsidiaries, authorised financial service providers, registered credit providers, and long-term insurer.
At Anglo American, the De Beers story continues to fascinate me
ArcelorMittal is “fundamentally different” – but when will the profits come?
Gemfields is being carried by emeralds
Mondi suffers an ugly drop in margins
At Anglo American, the De Beers story continues to fascinate me (JSE: AGL)
Anglo American has released results for the six months to June 2026. As you are probably aware, the company is in an important transition phase in which they are selling off some major assets.
The steelmaking coal deal is being implemented, with a price of up to $3.9 billion on the table (of which $2.2 billion is payable upfront).
The De Beers sale has been in the headlines, with speculation that the company is in talks to sell the business for $1 billion. I would encourage you to only believe numbers that are officially announced by the company. I must also remind you that such a sale is by no means guaranteed at any price.
There’s also a nickel disposal in the works, with the deal currently going through European competition authority approval processes.
And on top of all this, Anglo American is also busy with the planned merger with Teck to create a “global metals and minerals champion”!
With so much change in the business, Anglo is encouraging shareholders to work with underlying EBITDA from continuing operations. Helpfully, this metric happens to be up 35% for the six months to June 2026. An important and less-than-obvious nuance is that continuing operations actually includes De Beers, making this a more reasonable metric than you might think.
We won’t talk about the loss attributable to equity shareholders of $0.9 billion (driven by impairments), although it’s less ugly than the loss of $1.9 billion in the comparable period.
On the plus side, free cash flow was $803 million – a significant jump from $322 million in the prior period. The interim dividend has also moved much higher, from $0.07 per share to $0.23 per share. It’s still an absolutely tiny dividend yield on a share price of around R850!
If we look deeper, copper production was flat year-on-year, premium iron ore was down 2% and manganese ore increased 52%. Diamonds – those “rare” shiny things from the earth – saw production increase by 46%.
The pain in De Beers is best explained by this EBITDA table:
Yes, that’s a loss of $113 million at De Beers in the space of just six months. It’s better than the prior period thanks to the higher production, but that’s not saying much. If that rumoured $1 billion is true, I would take it and run.
Here’s the official wording from the financial report on the diamond market:
“At the retail level, global sales of finished diamond jewellery were stable year-on-year. There were encouraging consumer demand signals in the United States, where natural diamond jewellery sales returned to growth among independent jewellers. Demand in India remained robust, however demand overall in mainland China continued to decline.”
To be fair, they also say this:
“De Beers continued to progress its Origins strategy in the first half of 2026, with a particular focus on revitalising consumer desire for natural diamonds and streamlining the Group to manage the cost base. Following the encouraging performance of the Desert diamonds marketing campaign in late 2025, which seeks to promote natural diamonds across a range of colour hues, De Beers expanded the concept, with a new campaign focused on bridal, with a range of classic ‘icon’ designs set to launch in the second half.”
Ghost Bite: In a world where people can barely afford to have kids or buy a home, I don’t think natural diamonds will ever return to previous glory among mainstream buyers. It just is what it is.
ArcelorMittal is “fundamentally different” – but when will the profits come? (JSE: ACL)
The underlying EBITDA story is encouraging
ArcelorMittal has released results for the six months to June 2026. They start with a rather strong statement: “ArcelorMittal South Africa today is fundamentally different from eighteen months ago.”
That may be true, but they also just reported a loss of R1.49 billion vs. a loss of R1 billion a year ago. The numbers aren’t exactly matching that narrative, are they?
Of course, you have to stop dropping in order to start growing. Have they bottomed out, with management focusing on resizing the business and getting out of severely loss-making operations?
On a like-for-like basis, steel production was down 5%. Revenue fell by 1.4% on a similar basis. If you don’t make the like-for-like adjustments by the way, revenue was down 30%! This is why they can say things like “fundamentally different” – but it is fundamentally better?
Perhaps it is. This is where you have to be very careful, as quarterly momentum is critical in a turnaround. They are still loss-making, but losses are diminishing quickly. In Q3’25, underlying EBITDA (excluding the Long steel business) was a loss of over R1 billion. In Q2’26, it was a loss of only R67 million!
Despite some encouraging underlying momentum, the free cash outflow for the six months was almost R1.2 billion. This is why net borrowings increased from R5.8 billion to R7.9 billion between December 2025 and June 2026.
Looking ahead, one of the positives is the restart of smelting activities in the ferrochrome industry. This should boost commercial market coke sales in the second half of 2026 (of the non-fizzy drink variety). But what would really do wonders here is a return to positive EBITDA…
Ghost Bite: The 52-week low on this stock is R0.85 and the 52-week high is R1.88. The current level of R1.26 is pretty much smack in the middle. This remains a highly speculative stock, although range traders might find this chart interesting:
Gemfields is being carried by emeralds (JSE: GML)
Will the rubies play ball later this year?
Gemfields is a stock in distress. The share price has shed 47% year-to-date. If you can believe it, this is after a significant bounce from the 52-week low.
This business model has layers of risks. They have to deal with the variability of Mother Nature, as gemstones come out in all shapes and sizes (and thus grades). They also have to navigate the trials and tribulations of operating in Africa, ranging from fights with governments through to actual conflict on the ground.
To try and navigate this dangerous cocktail, the company has some (but not much) diversification. They mine rubies in Mozambique and emeralds in Zambia.
Mozambique has been a significant challenge recently. Recoveries of premium grade rubies have been weak. The benefit of the second processing plant will only be felt in months to come, as it will be fully commissioned later this year. In the meantime, the share price is as red as the rubies themselves.
In the green corner, we find a happier story in Zambia. Emerald production was strong during the first half, although they’ve had pressure on operating costs from increased mining activities and fuel costs.
Overall, total auction revenues were $102.9 million for the first half of the year, up from $60 million in the comparable period. The emeralds are no doubt doing the heavy lifting here. The net debt position of $44.2 million (before auction receivables of $33.3 million) remains a significant worry for investors.
Aah yes, I forgot to mention this particular layer of the risk cake: Gemfields carries a lot of debt.
Ghost Bite: The combination of operating leverage, financial leverage and political risk has had predictably unfortunate outcomes.
Mondi suffers an ugly drop in margins (JSE: MNP)
But clearly better than the market expected, with the share price up 12% on the day!
Mondi’s share price has been swirling the depths of the toilet since October last year.
The numbers for the six months to June 2026 aren’t a favourable story by any means, but they must’ve been better than the market had feared. That’s the only explanation for a 12% share price increase in response to news of HEPS dropping by 85%!
The broader paper and packaging sector is a cyclical affair that tests even the strongest stomachs. The debate at the moment is whether there’s a structural decline in addition to cyclical pressures. Areas like graphic paper (a focus at Sappi (JSE: SAP)) have been terrible, as the world has shunned printed magazines. But even Mondi, with an arguably better mix of products (a tilt towards packaging), has suffered the same fate over the past few years:
Looking at the Mondi numbers specifically, the results for the six months to June 2026 include a 2% increase in revenue. That sounds fine until you look at the profit margins. Underlying EBITDA (excluding forestry fair value movements) fell by 24%. Once you include the forestry movements as well (as Mondi must revalue its plantations), you’ll find that underlying EBITDA tanked by 33%.
This means that underlying EBITDA margin fell from 14.4% to 9.5%. Ouch.
If you’re hoping that the cash picture is more favourable, then I have bad news for you. Cash generated from operations fell by 17% to €347 million. They are clearly still profitable, but the direction of travel isn’t good.
The pain was felt primarily in the Corrugated Packaging segment, where underlying EBITDA margin literally halved from 15.0% to 7.5%. Return on capital employed was just 0.9% vs. 6.6% in the comparable period. The combination of higher input costs and lower average selling prices isn’t fun.
Flexible Packaging was far more resilient. Sure, there was a slight decline in revenue and a decline in EBITDA margin from 14.8% to 12.4%, but that is far more palatable than what we’ve seen in Corrugated Packaging. Return on capital employed was 8.7%, down from 11.5% in the comparable period.
Given the precipitous decline in EBITDA, it makes sense that net debt to underlying EBITDA has jumped from 2.5x to 3.2x. To give the balance sheet some breathing room, expected capex for 2026 has dipped from €550 million to €500 million.
With HEPS down 85%, some of the blow to investors was cushioned by the dividend decreasing by “only” 60%.
It’s worth mentioning the geographical exposure, as Mondi is primarily a European business. They generated 39% of revenue in Western Europe, 44% in Emerging Europe and less than 8% in Africa. In fact, North America generated slightly more than Africa! The European exposure isn’t fantastic for a consumer-focused value chain. The region isn’t exactly famous for growth.
Ghost Bite: There are certain sectors of the market that I just don’t play in. This is one of them.
We use cookies on our website to give you the most relevant experience by remembering your preferences and repeat visits. By clicking “Accept All”, you consent to the use of ALL the cookies. However, you may visit "Cookie Settings" to provide a controlled consent.
This website uses cookies to improve your experience while you navigate through the website. Out of these, the cookies that are categorized as necessary are stored on your browser as they are essential for the working of basic functionalities of the website. We also use third-party cookies that help us analyze and understand how you use this website. These cookies will be stored in your browser only with your consent. You also have the option to opt-out of these cookies. But opting out of some of these cookies may affect your browsing experience.
Necessary cookies are absolutely essential for the website to function properly. These cookies ensure basic functionalities and security features of the website, anonymously.
Cookie
Duration
Description
cookielawinfo-checkbox-analytics
11 months
This cookie is set by GDPR Cookie Consent plugin. The cookie is used to store the user consent for the cookies in the category "Analytics".
cookielawinfo-checkbox-functional
11 months
The cookie is set by GDPR cookie consent to record the user consent for the cookies in the category "Functional".
cookielawinfo-checkbox-necessary
11 months
This cookie is set by GDPR Cookie Consent plugin. The cookies is used to store the user consent for the cookies in the category "Necessary".
cookielawinfo-checkbox-others
11 months
This cookie is set by GDPR Cookie Consent plugin. The cookie is used to store the user consent for the cookies in the category "Other.
cookielawinfo-checkbox-performance
11 months
This cookie is set by GDPR Cookie Consent plugin. The cookie is used to store the user consent for the cookies in the category "Performance".
viewed_cookie_policy
11 months
The cookie is set by the GDPR Cookie Consent plugin and is used to store whether or not user has consented to the use of cookies. It does not store any personal data.
Functional cookies help to perform certain functionalities like sharing the content of the website on social media platforms, collect feedbacks, and other third-party features.
Performance cookies are used to understand and analyze the key performance indexes of the website which helps in delivering a better user experience for the visitors.
Analytical cookies are used to understand how visitors interact with the website. These cookies help provide information on metrics the number of visitors, bounce rate, traffic source, etc.
Advertisement cookies are used to provide visitors with relevant ads and marketing campaigns. These cookies track visitors across websites and collect information to provide customized ads.