

This is just a taste of what Ghost Mail subscribers get to enjoy every morning in their inboxes. Subscribe to Ghost Mail and join the community of investors.
CMH on Chinese cars (JSE: CMH)
Combined Motor Holdings released a trading statement and interim results just one day apart. The finance team must’ve worked very hard to achieve such clarity in the space of just 24 hours!
This poor financial reporting habit is at odds with the candid nature of the results commentary. I wish more companies wrote their management narrative the way that CMH does. I also wish that more companies would put some daylight between the trading statement and the release of results.
Anyway, the company put in a strong performance for the six months to August 2026.
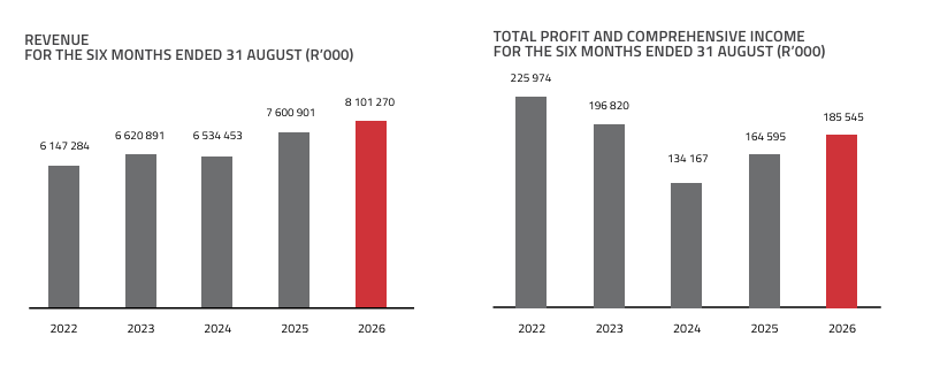
Revenue increased by 6.6% and operating profit was up by 13.9%, so that’s an elegant example of operating leverage. The group’s operating profit margin improved from 4.3% to 4.5%.
There’s more leverage as you work further down the income statement, as HEPS increased by 18.6%.

CMH is one of those companies with a fairly steady revenue profile and an erratic earnings trend. To their credit, they make it very easy to see this with these charts:
Now, that all sounds like a relatively easy period and a set of numbers that will help shareholders sleep at night. But as we read the commentary, we find some very interesting stuff.
Firstly, you’ll find an incredible statistic: the Chinese brands have seen their share of national sales rise from 14.8% to 20.0%. It’s rare to see such accelerated disruption.
In management’s words:
“With the proliferation of products and brands – and increasing each quarter, it is impossible to identify all the potential long-term winners.”
Ain’t that the truth?
It feels like barely a month goes by without a new brand entering the market.
The sobering comments continue, with CMH noting that many of the importers are overstocked with unrealistic expectations in the market. This is leading to very thin margins, with the variable volume incentives and bonuses being “virtually the only retained gross”.
In other words, when you look at those heavy discounts at the traditional car brands (like the ones I’ve seen at Volvo), you aren’t going crazy for wondering how anyone is making any money.
Here’s another fascinating comment from CMH that I’m going to repeat verbatim:
“The used car market has proven to be particularly difficult. The influx of Chinese/Asian brands that were introduced into the market at discount prices some four to five years ago are now at the recycle stage. However, the sharp depreciation in value of these vehicles has surprised owners and forced them to hold on for longer, until the trade-in values align with the residual amounts owed to banks.”
Put differently: people buying Chinese cars on a gazillion-year finance deal with their first-born child pledged as the residual security are going to have a bad time. But those people will only find that out a few years from now.
The real issue is that buyers of legacy brands (other than the really big ones) are experiencing the same problem anyway thanks to the accelerated depreciation caused by Chinese disruption, except their problems started at a higher price point.
This is causing a lot of pain in used car sales. CMH’s group unit sales in the used space were down 10%, while gross margin fell by 4.7%.
This is a very negative near-term read-through for WeBuyCars (JSE: WBC) of course, although the market already hates the stock these days:
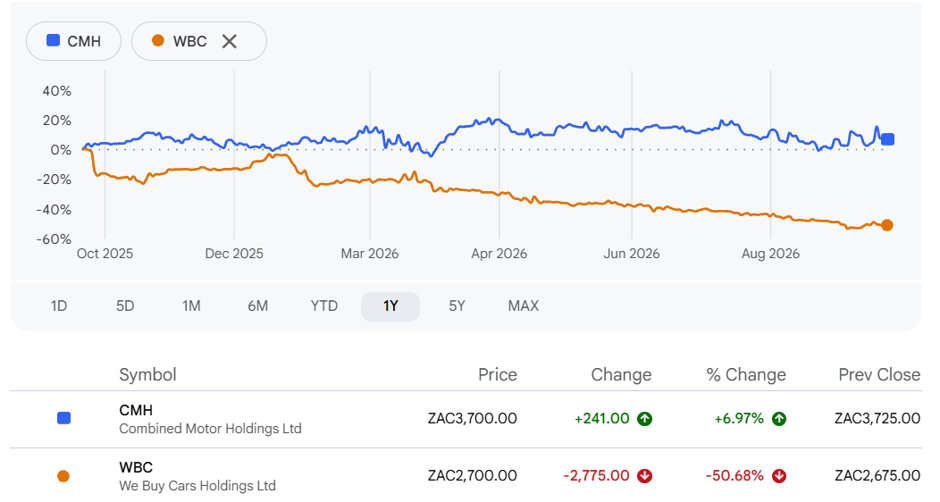
In case you’re wondering, I still hold WeBuyCars as a long-term play. I’m not sure we’ve seen the bottom yet, hence I’m waiting before I buy the dip of all dips.
My thesis on it is pretty simple: if it’s tough out there for all used car dealerships, then market consolidation and the survival of the fittest is a likely outcome in a super fragmented market.
The fittest (in my opinion) is the biggest, most data-pregnant option in the used car market.
That’s WeBuyCars.
Going back to CMH, the aftermarket parts department is struggling to maintain high levels of availability. This is another cautionary tale for anyone buying one of the obscure Chinese names, with CMH referring to “volatile demand and erratic supply chains”.
Some of this could just be teething issues of course, but I’ve seen plenty of online debate around parts availability (or lack thereof) for some of the Chinese brands.
CMH notes that the brands like Nissan, Volvo and Land Rover are experiencing declining workshop labour sales. This is important insight into how the business model falls over entirely for such brands: when sales dry up in year 1, the workshop feels it for several years.
All of this sounds so negative, so how did CMH do well?
You wouldn’t look at the numbers for the motor retail / distribution segment and conclude that CMH is struggling. Revenue grew by 6.3% and gross profit looked steady at 13.3%. Operating margin improved from 2.7% to 3.0%.
This means we have an intoxicating mix of CMH making good money from the Chinese brands, while also painting such a sobering picture of that market.
I always enjoy highlighting the structurally different margins in the car hire business. Revenue there was just R415 million vs. R7.6 billion in motor retail / distribution, yet the operating profit is much closer: R145 million vs. R223 million. That’s what happens when operating profit margin in car hire is 35% vs. just 3.0% in the motor trade!
The financial services business has also done very nicely in this period. It’s a small value-added service, but a profitable one. Thanks to the performance in areas like insurance, operating profit in that segment increased from R22 million to R30 million.
Overall, this is a rare example of a totally different tone in the narrative vs. the numbers. That makes me question how sustainable the meteoric rise of the Chinese brands really is.
A number of large updates needed to carry over to tomorrow to allow space for CMH, but I’ve covered a few shorter updates from the last couple of days below.
Calgro M3’s cash conundrum (JSE: CGR)
You won’t find fireworks at the top of the Calgro income statement for the six months to August 2026. Revenue increased by just 1.2%.
The residential property development segment is responsible for nearly 90% of group revenue. This segment experienced a revenue decline of -0.6%, anchoring the group to a flat performance despite the best efforts of the Memorial Parks segment (up 20%).
Gross profit margin in Residential Property Development ticked up from around 26.3% to 26.6%. It may not sound like much, but it’s something. Importantly, this remains above the group target of 20% to 25%, so there’s risk to the downside for gross margin in the core business.
The gross profit margin in Memorial Parks is much higher than Residential Property Development, coming in at 54.8% (vs. 50.4% in the comparable period). This is why the group gross profit margin was 29.5%, well above the level achieved in the Residential Property Development segment.
There are still question marks around the long-term economics of the Memorial Parks. But for now at least, it’s a useful source of cash for the group that helps balance some of the swings that a property developer can experience. More on that to come.
The problem is that with such limited revenue growth and a largely flat gross profit margin at group level, there wasn’t much of a buffer against the impact of rising operating costs. Sure enough, HEPS fell by 4.8% as the limited top-line performance filtered through the income statement.
In terms of the balance sheet, the group is currently rationalising its base of projects by disposing of non-core assets. There are various stages of completion here, as some of the properties are in the process of getting the correct rights or infrastructure in place, so the company reckons it needs five years to get all the disposals done.
This length of time and the complexities involved in offloading assets could be used by bears as partial justification for the discount to net asset value per share. A marketability discount exists for a reason, as it takes time in the real world to crystallise a sale of assets.
Still, Calgro’s net asset value per share of R17.21 is in a different postal code to the share price of R3.75. There’s a lot more to that discount than just the marketability of non-core assets. I suspect that the cash profile plays a big role here.
And this brings us neatly to the problem: cash utilised in operations deteriorated from R50.6 million to R110.3 million i.e. the business absorbed more than double the amount of cash that it did in the prior comparable period.
Once you take into account the finance costs paid, you’ll find that net cash utilised from operating activities was a whopping R159 million. They had to raise more debt to help fund the deficit, with cash and cash equivalents at the end of the period of just R52.3 million vs. R163 million a year ago.
Why did this happen?
It looks like the installation of infrastructure at the BDC project is to blame. Such is the joy of being a property developer: huge cash has to be sunk into the ground before you actually see a return. It’s a feature of the business model, not a bug.
At least the sectional title activities at Scottsdene, South Hills and Belhar should be completed in the latter half of the year, with 60% of the units having finalised guaranteed off-take agreements. That derisks the cash position to some extent, but there are still some scary numbers here for investors to consider.
For example, as great as it is that net debt to equity is still at a decent level, the bigger worry is that the debt service cover ratio of 1.35 isn’t particularly far above the covenant level of 1.2.
Management was on Unlock the Stock this week. The YouTube recording is now available, with a particularly vibrant Q&A that focused on the cash topics:
Oversubscribed capital raise at Fairvest (JSE: FTA | JSE: FTB)
As expected, Fairvest had absolutely no problem raising fresh equity capital. Demand was strong enough that the company ended up raising more than planned.
But the extent of the increase in the raise is quite something to behold.
Having planned to raise R500 million in new B shares, the company eventually raised R1.25 billion at a discount of just 2.7% to the 30-day volume-weighted average price (VWAP).
And get this: the book was still oversubscribed even at this level!
The JSE is a very exciting place for property companies, but investors must always be wary of things getting too hot in this space.
But not all the property counters achieve a premium valuation. Small and obscure names still find it tougher to raise capital and get much attention, making a potential delisting all the more likely.
A suite of mining updates: BHP (JSE: BHG), Anglo American (JSE: AGL), Kumba Iron Ore (JSE: KIO), DRDGOLD (JSE: DRD) and Tharisa (JSE: THA)
Starting with the quarterly activities report at BHP, full year guidance is unchanged across the board. This tells us that things have been largely in line with company expectations.
But this doesn’t mean that production went up!
For example, copper production fell by 19% year-on-year, driven by planned grade declines and scheduled maintenance, as well as other factors like the weather in Chile and various operational challenges. That’s a pity, as copper prices were 53% higher than a year ago.
Bulk commodities did well despite maintenance in this quarter, with Western Australia Iron Ore (WAIO) setting records at the mine and port with production growth of 4% year-on-year. Iron ore prices were down 9% in USD terms though, so they certainly aren’t enjoying the pricing tailwind that we are seeing in copper.
Steelmaking coal grew production by 1% and enjoyed a price increase of 34% year-on-year.
Energy coal production jumped by 26% at a time when prices were up 23%, so that’s very encouraging.
The investment in potash is getting closer to fruition, with stage 1 of the Jansen project now 87% complete.
Then we have another big name in the sector: Anglo American. The geographical profile of the group means that the winter weather in Chile has played a role here as well. Still, Anglo is also on track to meet their FY26 guidance, with copper ore grades expected to improve in the final quarter of the year.
I’ll deal with the so-called “simplified portfolio” first. Year-to-date copper and premium iron ore dipped by 1% and 3% respectively, while manganese ore production increased by 31%. If we isolate the latest quarter, copper and premium iron ore fell by 5% and 4% respectively, while manganese iron ore was up 6%.
Moving on to the businesses that Anglo American is getting rid of, we find a 4% year-to-date increase in steelmaking coal production. The quarterly jump is much higher at 53%! The sale of steelmaking coal to Dhilmar is on track to complete by the first quarter of 2027.
The nickel business saw production decline by 3% year-to-date and increase by 3% for the quarter. The group is currently working through the EU regulatory approval process to sell that asset.
And then the bright, shiny elephant in the room: De Beers.
Production is up by 22% year-to-date, so I think the game is up in terms of mined diamonds being rare things. Having said that, production was down by 11% in the latest quarter due to planned maintenance and a slowdown ahead of the previously announced production pause.
They really are trying everything here, but diamond prices just keep dropping.
Very few people have the money or the interest in mined diamonds vs. identical lab-grown alternatives at a fraction of the price.
Anglo says that the company continues to “work towards a transaction in a challenging market, having taken decisive action to protect cash and preserve value” at De Beers. Disruption is a helluva thing.
Next up is Kumba Iron Ore, part of the Anglo stable. Total production fell by 19% year-on-year due to the temporary shutdown of the Sishen dense-media-separation plant.
I really hope that nobody ever refers to me as dense media!
Thanks to the levels of finished stock at the ports, sales increased by 3%. Finished stock has now declined from 7.0 Mt to 4.8 Mt. They were able to successfully absorb the impact of lower production.
It really says a lot about our rail infrastructure in this country that Kumba has to carefully manage the difference between stock at the mine and stock at the port. Case in point: ore railed to port declined by 8%, largely driven by a derailment that impacted volumes.
Export iron ore prices didn’t play ball this quarter, impacted by Chinese steel mill profitability challenges. Kumba is still achieving a premium to the benchmark price due to the quality of its premium product, but the year-to-date decline in dollar pricing is 6%.
Cost guidance for the year is unchanged, with Sishen expected to be at the upper end of the range and Kolomela expected to be at the lower end.
Onwards to DRDGOLD and an operating update for the quarter ended September 2026, a period in which the average gold price received increased by 14% on a year-on-year basis.
It was down by 6% sequentially though, so there’s plenty of debate around where the gold price might go from here.
DRDGOLD can’t control the price, but it can control production. Gold production increased by 10% year-on-year and 2% sequentially, in both cases supported by improving yield despite a decrease in tonnage throughput.
Sales can deviate from production, with gold sales up 14% year-on-year and flat sequentially. This led to a 31% increase in revenue year-on-year, but a 6% decline sequentially.
Cash operating costs were driven by higher input costs like diesel, as well as increased purchasing and processing of higher-grade third-party material. Electricity and labour costs are always a factor as well.
Overall, operating costs increased by 12% year-on-year and 6% sequentially.
Add it all together and you’ll find incredible variance in operating profit depending on which base period you use. On a year-on-year basis, operating profit was up by 42%. But sequentially, it fell by 14%.
Operating leverage essentially amplifies the change in the gold price, leading to bigger swings in operating profit than in the underlying commodity.
The company is in a significant capex cycle at the moment, with various Vision 2028 projects underway. Growth capex was very high in the quarter ended June (R1.16 billion), so the latest quarter looks tame in comparison at R556 million (down 52%). Growth capex is also down 29% year-on-year.
Sustaining capex tells a different story though, up 22% sequentially and 132% year-on-year.
The group remains debt free despite all this capex. They have access to bank financing, but for now the R2.45 billion on the balance sheet is adequately supporting the business.
For context, the free cash inflow in this quarter was R725.8 million, benefitting from solid profitability and relatively lower growth capex.
DRDGOLD has reaffirmed its FY27 production and operating cost guidance.
At Tharisa, the first wheeled renewable energy from Etana Energy was received in September 2026. This will meet roughly 10% of the Tharisa Mine’s current monthly electricity demand.
That’s obviously good news for the reduction of energy costs and the improvement of environmental metrics.
There’s more to come, with Etana Energy forecast to supply 70% of Tharisa Mine’s current electricity demand over the long term.
I must point out that these percentages relate only to the open pit operation, not the planned underground project which is expected to double the operation’s electricity demand.
Always do your own research and do not treat anything you have read here as financial advice.