Combined Motor Holdings (or CMH as everyone calls it) has released financials for the year ended February 2022. With Headline Earnings per Share (HEPS) up 117%, it was a year to remember.
Revenue increased by just over 30% and operating profit jumped by 75.7%, reflecting the joys of operating leverage (fixed costs in the cost structure) and positive JAWS (income growth higher than expense growth).
The operating profit margin has expanded from 4% in FY21 to 5.4% in FY22. A particularly impressive outcome was the jump in return on equity from 19.6% to 37.1%.
Looking at the segments, the core retail motor division (94% of group revenue) increased revenue by 28% and the car hire business recovered sharply with a 92% jump in group revenue. That division only contributes 4% of group revenue. A further 1% is from Financial Services and 1% is in the Corporate Services and Other division, which all accountants know is like that weird drawer in your bedroom where you keep lots of random things.
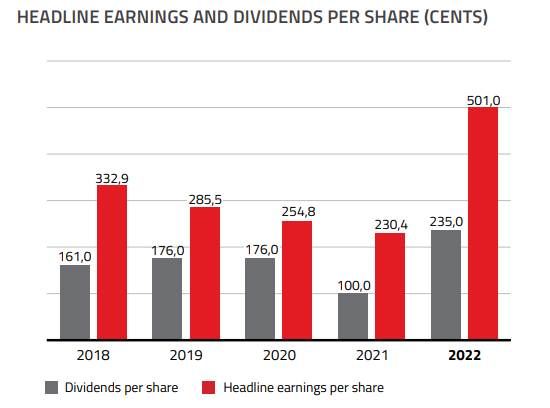
HEPS increased from 230.4 cents to 501 cents and dividends per share increased from 100 cents to 235 cents, reflecting a payout ratio this year of around 47% which is slightly higher than in the prior year.
To put that blockbuster year into perspective, I’ve included the HEPS chart below from the results booklet:
The share price of R28 reflects a trailing Price/Earnings multiple of around 5.6x on these earnings. The multiple is closer to 10x if we use pre-pandemic numbers as a more normalised view on the business.
CMH’s share price is up 12.5% this year and nearly 53% over the past twelve months. The motor trade has been an unlikely winner during a period of tricky supply chains. The difficulty for investors lies in estimating the extent to which these earnings can be maintained.
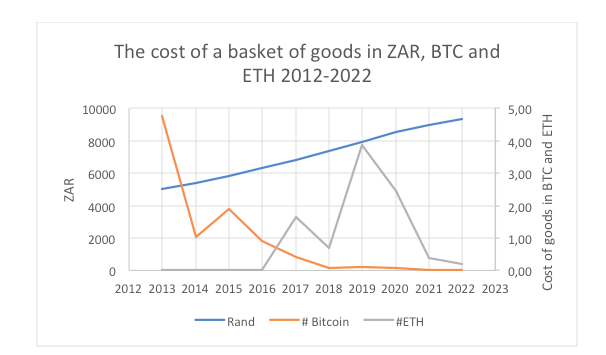
A basket of goods in 2013 grew by 36% in just 4 years, due to inflation
The deflationary power of cryptos such as BTC and ETH reflects the financial shift that we are witnessing today
Blockchain research house Glassnode, shows that BTC holders are in this for the long-term
Unlike rands or any other traditional currency, Bitcoin is designed to have a limited supply, so it can’t be devalued by a government or a central bank distributing or creating too much of it. While over the past few years, the traditional currencies we use have diminished our buying power, while those who opted for digital currencies have seen an increase in theirs.
To illustrate this point, we took a basket of goods from a decade ago and escalated the prices by the consumer inflation rate. Assuming that basket of goods cost R5,000 in 2013, by early 2022 it had nearly doubled in price to R9,375.
Using BTC as the currency, that same basket would have cost 4.75 BTC in 2013 and today, it costs 0.01 BTC.
Ethereum, the second-largest crypto as measured by market cap, has been around since 2015 so we have less data to work with. The ETH price was extremely volatile in the first two years of its creation, climbing from about R3,000 in early 2017 to just short of R20,000 in early 2018, before collapsing more than 90% to around R1,200 later that year.
Then Ethereum began its steady but inexorable climb to above R75,000 in late 2021, before giving up some of its gains. In April 2022, it traded at R47,000.
Our R5,000 basket of goods had escalated in ZAR to R6,800 by 2017. If we used Ether as the purchasing currency, it would have cost 1.65 ETH in 2017 and then more than doubled in price to close to 4 ETH in 2019. That same basket of goods today would cost 0.21 ETH.
Source: Jaltech, StatsSA
Bitcoin and Ethereum have entirely different use cases: Bitcoin is regarded as a digital store of value, while Ethereum is challenging financial orthodoxy through the use of blockchain and smart contracts.
Bitcoin has been dismissed time and again by many of the titans of Wall Street, among them Warren Buffet and JP Morgan Chase’s CEO Jamie Dimon, who called it a ‘fraud’ and ‘worthless’, yet the number of corporate investors present at the recent Bitcoin Conference in Miami suggests cryptos are here to stay. There will be some spectacular failures along the way, but virtually all major banks now have at least one or two analysts dedicated to studying and following cryptos. They dedicate their time to identifying the tracking the winners, such as BTC and ETH.
Graphs like the one above can no longer be dismissed by serious analysts. The deflationary power of cryptos such as BTC and ETH reflects the financial shift that we are witnessing where annual interest yields of 20% or more are being earned on decentralised finance (DeFi) platforms, where collateralised loans can be taken out without having to submit so much as a name or email address, where transactions can be settled in seconds rather than days. Where credit committees and bank managers are rendered irrelevant.
The growth in crypto value will never be a smooth line, but crypto enthusiasts are accustomed to this. After peaking above R300,000 in 2017, BTC dropped 84% in price over the following year, before reversing the trend and shooting above R1 million. ETH dropped more than 90% in 2018 before screaming back up more than 2,000%. The peaks and troughs are often extreme, but the same volatility was evident in the early years of Amazon and Apple stock trading. It is already clear that both ETH and BTC are far less volatile today than was the case just a few years ago.
Blockchain research house Glassnode shows that BTC holders are increasingly in this for the long haul. They can now stake their coins – putting them to work on the blockchain for which they earn rewards – and they can borrow against their cryptos to leverage their positions. In other words, the case for owning cryptos is getting more compelling by the month.
Jaltech offers everyday people effortless and convenient access to the cryptocurrency market.
One of Jaltech’s investments is its Cryptocurrency Baskets which is tailored for investors who are looking for an investment option that provides investors with exposure and diversification across protocols, digital currency and blockchain technology.
There were two announcements released by Renergen yesterday. One was a formal financial report and the other was an excitement-filled update on progress at the Virginia Gas Project. Nobody can ever accuse Renergen of not injecting a little passion into SENS.
The financial report in question is a preliminary report on the year ended February 2022. As I often remind you, the company’s valuation is not based on anything you’ll find in the income statement. The key Virginia Gas Project is still being brought into operation, which is why Renergen gives such frequent and detailed updates on its progress.
Revenue was just R2.6 million and the loss attributable to shareholders was R33.8 million. See what I mean?
Operating costs decreased by R6.8 million thanks to lower consulting fees and employee costs, along with swings in net foreign exchange. The benefits were mitigated to some extent by listing costs and other legal and professional fees.
In September 2021, Renergen made a final drawdown of R112.1 million on the loan facility from the US International Development Finance Corporation. The local Industrial Development Corporation (IDC) gave Renergen a loan facility of R160.7 million in December 2021, of which Renergen has used R158.8 million. Developing a resource production facility isn’t a cheap exercise.
The real story behind the company is found beyond the financials. Renergen has been busy securing LNG and helium offtake agreements and has enjoyed 5 out of 6 drilling successes from the exploration campaign.
To give more context to the achievements, offtake agreements with Consol Glass and a subsidiary of Italtile have already covered 60% of planned phase 1 production of LNG. The remaining 40% is going to the logistics market in a dual fuel application for heavy trucks.
On the helium side, 65% of planned phase II production has already been contracted under take-or-pay contracts that are between 10 and 15 years in length. The group is hanging on to the rest, with an intention to place it in the spot market. In and amongst all this, Renergen also developed a transportation solution for vaccines called Cryo-Vacc. Demand for vaccines has fallen off a cliff, but Renergen may be able to find a market for the technology in verticals like gene therapy and similar niches. Renergen spent R10.9 million developing this solution, so they need to generate a return somehow. It pales in comparison o the R260.7 million on the Virginia Gas Plant in this period but is still a meaningful number.
Renergen had R95 million in unrestricted cash reserves at the end of the period. Subsequently, Ivanhoe Mines subscriber for shares for over R200 million. A much larger deal is the planned sale of 10% of Renergen’s operating subsidiary to the Central Energy Fund for R1 billion. The proceeds will be used for the phase II development.
The share price is up 18% this year and over 60% in the past twelve months.
Central banks use verbal guidance as a tool to prompt financial markets to adjust long before a policy-changing decision is taken and implemented. Forward guidance, as it is referred to, has been used as a tool more often by central banks following the 2008 financial crisis and involves providing information about its future monetary policy intentions based on its assessment of the outlook for price stability. This aims to influence the financial decisions of economic actors by providing a guidepost. The greater the credibility of the central bank, the greater the market response, and the heavier the burden of self-regulation that is carried by the financial markets to moderate the cycle.
One must think about the interplay between financial markets and the yield curve a little more deeply to fully appreciate the power of this tool. It also means that a central bank need not act as tough as it communicates, and therein lies the conundrum for investors. Should they take the central bank at face value, or should they rather focus on how much the underlying bond market has already priced in and achieved in moderating the cycle? The answer is always a bit of both.
Forward guidance has a pre-emptive impact in the markets and the real economy
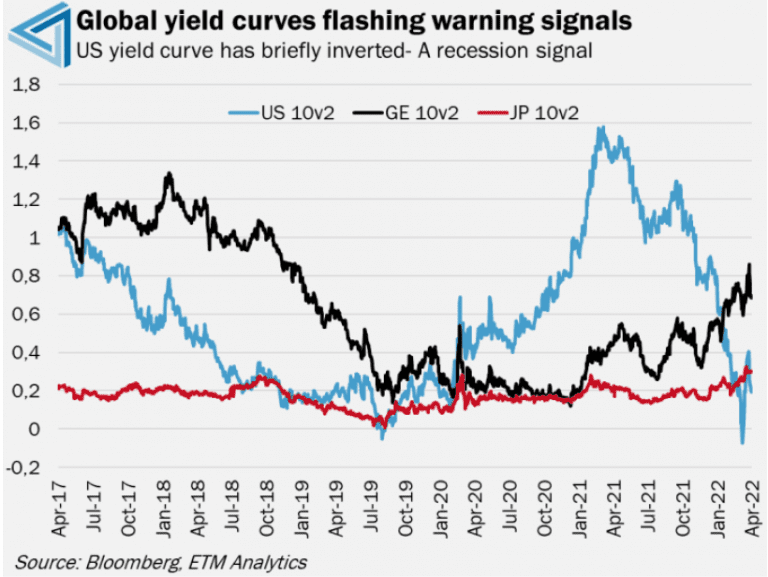
The Fed this year has taken on a notably more hawkish stance towards its monetary policy, with this peaking recently when Chair Powell suggested that more than one 50bp rate hike could be on the cards for this year. The market has responded with the USD surging, while UST yields have climbed to highs not seen since 2019. This rise for UST yields has been more concentrated along the front end of the curve, flattening it out to the extent that the curve inverted over the 10v2 spread briefly at the start of April.
The fact that interest rates over the short-term have risen to near longer-term rates suggests that the market sees heightened near-term economic risks. These risks have come from the expectation that the Fed will hike rates aggressively over the coming months, choking liquidity in the market and effectively tightening financing conditions already without the Fed actually hiking aggressively yet.
This hawkish forward guidance will also send a message to financial officers of companies that interest rates are set to rise, impacting the decision to roll over debt. Higher interest rates in the near term will make rolling over debt less attractive as it will have to be repriced at a higher rate. If options are limited and revenues are weak, debt may need to be rolled over regardless, leading to higher debt servicing costs which will threaten the longer-term profitability and growth prospects of a company.
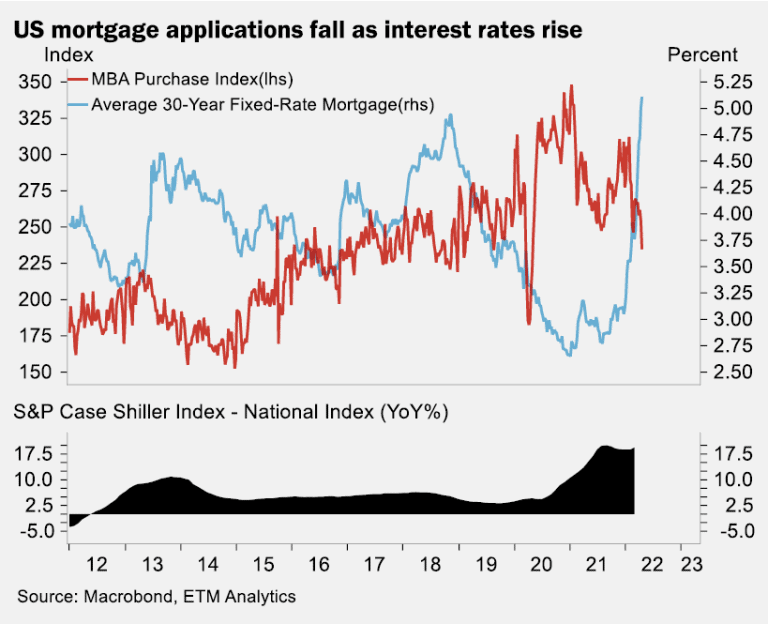
The tightening effect that this hawkish talk has in the real economy can already be felt, with US mortgage rates surging to over 5.00% recently. This compares to levels closer to 3.00% at the start of the year. This more than 200bp increase for 30-year fixed mortgage rates has come while the Fed has hiked, until now, by only 25bp. This perfectly illustrates the power that forward guidance can have, and that the aggressive talk with regard to tightening monetary policy can manifest in the markets as tighter financial conditions without rates actually being hiked so aggressively. These higher mortgage rates have already translated into lower house prices and weaker sales, as reflected in the chart below:
Bottom-line:
Global central banks have drastically stepped up their aggressive hawkish communication in order to prepare the markets for the tightening of monetary policy. The markets, therefore, have priced in a future of lower liquidity and higher interest rates, effectively doing some of the work of the central banks for them. However, the Fed and its peers will need to follow through with their hawkishness to some degree and hike after this aggressive guidance to ensure their credibility. Otherwise, the market will begin ignore future guidance, limiting its impact and forcing even greater policy moves in the future to achieve the desired policy goal.
EOH has released updated pro forma financial effects related to the disposal of the Information Services Group. In simpler terms, this means that the company is helping investors understand what the financial picture will be after the latest sale of assets to help settle debts.
EOH has been managing to dispose of its “intellectual property” assets at EBITDA multiples of just over 5x. This leaves behind the core businesses of iOCO (an ICT distributor and systems integrator) and NEXTEC, focused on people outsourcing solutions and intelligent infrastructure.
When the Information Services Group deal was initially announced, the pro forma effects were based on EOH’s results for the year ended July 2021. As these are outdated and differ from the latest results by more than 10%, EOH is required under JSE rules to provide updated pro forma effects.
“Pro forma” just means that the accountants present numbers at a specific date as though the transaction had gone ahead, even though it hadn’t. In this case, EOH has used 31 January 2022.
On this assumption, Headline Earnings per Share (HEPS) would’ve been 34 cents instead of 41 cents, as the company has sold off some of its earnings. Net asset value per share would’ve been 108 cents instead of 114 cents.
To give an idea of how much trouble the balance sheet is still in, net tangible asset value per share (i.e. excluding intangible assets like goodwill etc.) would be negative 380 cents per share.
These updated pro forma numbers should be read in conjunction with the deal circular. You can read this here
Impala Platinum has released a production report for the three months ended 31 March 2022, which represents the third quarter of the financial year. Mining companies have been disappointing the market in the past couple of weeks, with production numbers taking knocks from supply chain issues and Covid-related disruptions.
Gross group concentrate production fell 2% in this quarter and tonnes milled fell by 4%, so Implats wasn’t immune to issues. Refined 6E production fell by 8%, impacted by lower concentrate volumes, while 6E sales volumes declined by 3%.
There was a general reduction in stock levels in the comparable period (especially in iridium and ruthenium). This period also saw some destocking of inventory (evidenced by a lower impact on sales than on production volumes).
With a nine-month lens, Implats has seen a 6% decrease in gross refined 6E concentrate production. This is attributable to more maintenance needing to be done in this period than in the prior period. Sales volumes of 6E fell by 4% with the same destocking explanations applying.
Impala Rustenburg had a particularly rough quarter, with production down 10%. Numerous issues including safety stoppages, cable theft, electricity curtailment (I assume this means load shedding) and community disruptions were at play. Over nine months, refined 6E production fell 16% with the additional impact of maintenance.
Zimplats achieved marginal improvements in this quarter. 6E matte production in the nine-month period was 2% higher than the comparable period.
In smaller operations, Marula achieved a 5% increase in 6E concentrate production this quarter and is up 9% for the nine-month period. Mimosa saw a 6% decrease in production in this quarter and for the nine-month period. Despite numerous issues, Two Rivers increased concentrate production by 7% in the quarter and flat volumes for the nine-month period.
Looking abroad, Impala Canada experienced a 4% drop in concentrate production in this quarter. The nine-month result is a 3% drop in production.
The IRS operation achieved 5% growth in refined 6E production in this quarter, with higher deliveries from third parties helping to offset delays from Mimosa and Zimplats. Over nine months, mine-to-market receipts dropped by 3% and third-party and toll receipts were slightly higher. The announcement doesn’t indicate a percentage change in production over the longer period.
And in case you’ve been living under one of the rocks at the mines, Impala Platinum is in the process of acquiring Royal Bafokeng Platinum via an offer to shareholders. Impala holds around 37.79% in Royal Bafokeng thanks to shareholders who already accepted the offer. The offer is still open.
Importantly, guidance for the full year that was provided at the time of the interim results has been reiterated.
The world’s most practically-named REIT has released a trading update for the fourth quarter of its 2022 financial year, which covers the January – March period.
The fund experienced a record quarter for deal volumes i.e. leasing transactions. This means that demand remains strong for multi-let industrial space in the UK. 53% of completed leases were structured as the REIT’s short-form digital “Smart Leases” which is encouraging for the platform. Driving leasing enquiries through the company website means that the company is engaging directly with tenants rather than working through third party agents or portals.
Importantly, average rent increased 22% for the quarter, which is a number that office and even retail funds can only dream of. Uplift was as high as 34% on new lettings! This is the sixth quarter where average uplifts on new lettings was over 20%.
These uplifts only apply to renewed and new leases, of course. Looking across the entire portfolio, like-for-like rent increased by 1.5% during the quarter and met the goal of 4% to 5% growth per annum.
The average lease term granted increased from 4.2 years to 4.9 years, with the average rent-free incentive up from 1 month to 1.2 months.
The fund executed GBP21 million of acquisitions in this quarter and has a strong pipeline of opportunities. The acquisitions are being executed below replacement cost.
After the end of the quarter, a further deal of GBP3.1 million was executed on a net initial yield of 5.2%. A further two industrial estates are under offer with a combined value of GBP7.2 million.
The loan to value ratio at the end of March was 31%.
The share price has fallen 8.6% this year and is 10.5% higher over the past 12 months.
Unlock the Stock is a platform designed to let retail investors experience life as a sell-side analyst. Companies do a presentation and then we open the floor to an interactive Q&A session, facilitated by the hosts.
I co-host these events with Mark Tobin, a highly experienced markets analyst who combines an Irish accent with deep knowledge in the Australian market (I know, right?) and the team from Keyter Rech Investor Solutions.
You can find all the previous events on the YouTube channel at this link.
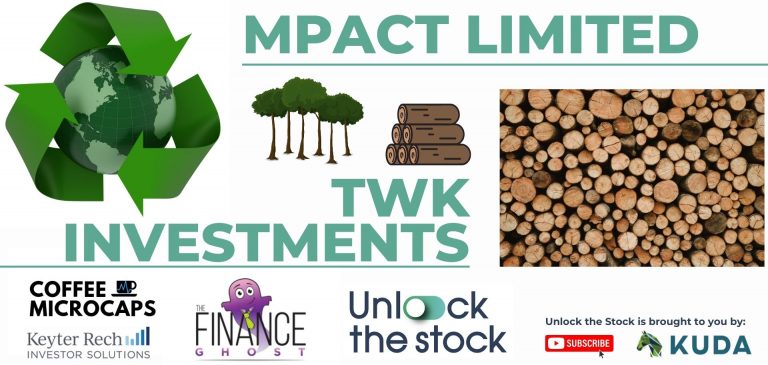
In this Unlock the Stock event on 14th April 2022, we hosted Mpact Limited and TWK Investments. Both of these groups are involved in the heartland of our economy, with Mpact focused on the “circular economy” (recycled products) and TWK servicing the agriculture industry.
Sit back, relax and enjoy this video recording of our session with Mpact and TWK:
You may need a strong coffee to get through this update in one piece. If you feel like helping Tongaat out of its sticky situation, you may want to add sugar to it.
Tongaat primarily operates in KwaZulu-Natal, a province that is making a strong case to be the destination for the next Survivor series. The riots simply added to problems that Tongaat already had, with years of poor maintenance leading to lower production, higher costs and more capital expenditure. We will get to the floods later.
I often write about operating leverage, which refers to the proportion of fixed vs. variable costs. With high operating leverage (more fixed costs), the good times are great and the bad times are horrible. Manufacturing companies typically have high operating leverage and Tongaat is no different, so a 9% drop in sugar production caused havoc on profitability.
It didn’t help that the last quarter of the year saw a shift to low margin bulk sugar sales, while consumers turned to cheaper private label brands rather than “miller brands” in the sugar aisle.
Against this backdrop, it’s not surprising that the South African operations are expected to report a loss for the year ended March 2022. The resultant pressure on local cash flows is terrible news for Tongaat, as most of the group’s debt is carried by the South African operations. More on the balance sheet to come.
Things weren’t great in the Zimbabwe sugar operations, with the usual macroeconomic issues driving a higher proportion of sales in Zimbabwe Dollars rather than US Dollars. This made it more difficult to repatriate profits, which isn’t good news when a company is struggling with its balance sheet.
The narrative was positive in Mozambique at least, with higher domestic and export sales. The future looks good as well, with extensive cane root replanting with modern varieties completed and set to benefit the business over the next two years.
The Botswana sugar packing operation was negatively impacted by aggressive pricing by competitors. Cheaper sugar imports entering the country hampered this part of the business.
If you thought the sugar businesses sound difficult, you will be interested to know that Tongaat also has a property division based in KwaZulu-Natal. I think that getting people to pay their TV Licences is probably easier than trying to sell property in that province. Tongaat remains convinced that the intrinsic value of the portfolio is intact and that a sales pipeline is being built for the 2023 financial year.
Net borrowings at the end of March 2022 were R6.8 billion (up from R5.8 billion a year ago) of which R5.5 billion is owed to South African lenders. The balance is trade finance provided by the South African Sugar Association.
Based on how horrible the last few months have been, the envisaged rights offer has been increased to between R4 billion and R5 billion. This is a company with a market cap of just R500 million!
A trading statement covering the year to March 2022 confirms the extent of the pain, with Tongaat expected to suffer a drop of at least 120% in earnings per share. This implies a loss per share of at least -358 cents per share vs. a profit per share of 1,794 cents in the prior period (which did include results of businesses that have subsequently been sold).
But that’s not all, folks. Subsequent to this financial period, the province Tongaat calls home was hammered by terrible floods. Tongaat notes that production started looking stronger until the flooding caused the mills and refinery to stop production.
There has thankfully been no significant damage to the milling infrastructure, but mills were shut for the past 10 days and production can only resume once farmers can access waterlogged fields to harvest cane.
The refinery site was flooded and municipal services to the site have been “compromised” so resumption of normal operations may be delayed.
In summary, this really has been a horror story for investors.
Mediclinichas provided a trading update for the year ended March 2022. With full results scheduled for release on 25 May, this gives the market a taste of what happened in that period.
As I’ve written many times before on this platform, the hospital groups were not beneficiaries of the pandemic. The cancellation of elective procedures caused havoc with operating margins. The latest results demonstrate that a recovery from that tough period is well underway.
Revenue grew by 8% and group EBITDA margin came in at around 16%, a 180bps improvement from the 14.2% result in the prior year. Revenue is now ahead of the FY20 period (GBP3.2 billion vs. GBP3 billion) but EBITDA margin hasn’t fully recovered yet, running 150bps below the FY20 margin of 17.5%.
Investors will appreciate the improvements in the balance sheet. After a tough period in FY21 with low cash conversion of profit into cash generated from operations (just 77%), a 125% conversion rate in FY22 reflects a period in which working capital swung positively.
Thanks to strong cash conversion, the group net debt / EBITDA ratio has improved from 5.1x to 4.0x. Importantly, this is better than the 4.3x reported in FY20.
Mediclinic’s share price is trading only slightly below pre-pandemic levels and is up around 7% this year.
We use cookies on our website to give you the most relevant experience by remembering your preferences and repeat visits. By clicking “Accept All”, you consent to the use of ALL the cookies. However, you may visit "Cookie Settings" to provide a controlled consent.
This website uses cookies to improve your experience while you navigate through the website. Out of these, the cookies that are categorized as necessary are stored on your browser as they are essential for the working of basic functionalities of the website. We also use third-party cookies that help us analyze and understand how you use this website. These cookies will be stored in your browser only with your consent. You also have the option to opt-out of these cookies. But opting out of some of these cookies may affect your browsing experience.
Necessary cookies are absolutely essential for the website to function properly. These cookies ensure basic functionalities and security features of the website, anonymously.
Cookie
Duration
Description
cookielawinfo-checkbox-analytics
11 months
This cookie is set by GDPR Cookie Consent plugin. The cookie is used to store the user consent for the cookies in the category "Analytics".
cookielawinfo-checkbox-functional
11 months
The cookie is set by GDPR cookie consent to record the user consent for the cookies in the category "Functional".
cookielawinfo-checkbox-necessary
11 months
This cookie is set by GDPR Cookie Consent plugin. The cookies is used to store the user consent for the cookies in the category "Necessary".
cookielawinfo-checkbox-others
11 months
This cookie is set by GDPR Cookie Consent plugin. The cookie is used to store the user consent for the cookies in the category "Other.
cookielawinfo-checkbox-performance
11 months
This cookie is set by GDPR Cookie Consent plugin. The cookie is used to store the user consent for the cookies in the category "Performance".
viewed_cookie_policy
11 months
The cookie is set by the GDPR Cookie Consent plugin and is used to store whether or not user has consented to the use of cookies. It does not store any personal data.
Functional cookies help to perform certain functionalities like sharing the content of the website on social media platforms, collect feedbacks, and other third-party features.
Performance cookies are used to understand and analyze the key performance indexes of the website which helps in delivering a better user experience for the visitors.
Analytical cookies are used to understand how visitors interact with the website. These cookies help provide information on metrics the number of visitors, bounce rate, traffic source, etc.
Advertisement cookies are used to provide visitors with relevant ads and marketing campaigns. These cookies track visitors across websites and collect information to provide customized ads.