AECI Mining has achieved a significant margin uplift
With the share price up by roughly 16% year-to-date (and we are only in February), AECI is clearly doing something right. The group turnaround is showing decent momentum, with the release of results for the year to December 2025 confirming that HEPS is moving firmly in the right direction.
Revenue from continuing operations may have dipped by 4%, but EBITDA from those operations was up 12% as margins improved.
You pay dividends (and reduce debt) with profits, not revenue!
Earnings per share from continuing operations improved by 36%, while HEPS was up by an excellent 53%. Before you get too excited, the dividend was only 4% higher, so this HEPS move hasn’t been backed up by an exciting dividend move.
But here’s why: net debt has plummeted from R3.7 billion to R465 million. It doesn’t help to ramp up the dividends to shareholders while you owe the bank. AECI has quite rightly taken the improved earnings and used them to stabilise the balance sheet. They also realised R2.2 billion in asset disposals, so that did wonders for debt reduction.
AECI Mining did the heavy lifting in terms of EBITDA margin, achieving its highest ever EBITDA despite a drop in revenue. They’ve focused on margins and pricing in the business, with the results clear to see. EBITDA margin improved from 12% to 15%.
AECI Chemicals remains a problem though. Margins went the other way, as a 4.5% revenue increase was accompanied by a 5% decline in EBITDA. Pricing pressure was one factor, with expected credit losses being another. On the plus side, segmental free cash flow improved by 34%.
Overall, they are making significant progress.
Solid numbers at Bidcorp (JSE: BID)
The company has spent years growing into its valuation
Bidcorp is easily one of the best examples of a company that has roots in South Africa and beautiful blooms all over the place in offshore markets. Through bolt-on acquisitions and a consistent strategy, they’ve built what can genuinely be referred to as a food service empire.
The valuation was always helped along by the “rand hedge” era, in which companies were desperate to have exposure elsewhere. South Africa is on a much firmer footing now, so investors are less inclined to chase offshore opportunites. Combined with a demanding valuation, this is why the total return in this stock over three years is only 18%. That’s in the green, but not exciting.
But at some point, the company will have grown into its valuation. The share price is down 7.5% in the past year, yet the freshly-released results for the six months to December 2025 reflect growth in HEPS of 8.5% (or 6.9% in constant currency). The Price/Earnings (P/E) multiple is now in the mid-teens. For such a great company, that’s starting to become interesting.
For all the rand strength that we keep talking about, it’s worth remembering that this is mainly against the US dollar – a market that Bidcorp doesn’t operate in. This is why revenue for the period was up 7.1% as reported, or 5.9% in constant currency. There’s still a rand hedge element to this story, as the rand tends to weaken against the markets where Bidcorp operates.
Trading profit increased 8.1% as reported (6.9% in constant currency), so margins improved in this period. But nothing improved quite as much as the cash margins, with cash generated by operations (net of working capital) up by a juicy 27.2%. Working capital can skew this from period to period, but that’s still good to see.
The interim dividend increased by 9.8% – a solid outcome.
A scan of the segmental numbers does reveal one ugly duckling. And of course, it would be Australasia, the ultimate widowmaker for South African businesses. Revenue fell 0.3% and trading profit was down 4.6%. They note cost inflation, a tight labour market and ongoing wage inflation.
Believe me, if Bidcorp is struggling in that market, then the clothing retailers must still be getting hammered.
Dividends are back at Blu Label Unlimited (JSE: BLU)
But the numbers are still impacted by accounting complexities related to Cell C
Blu Label has had quite a year. They successfully executed the separate listing of Cell C (JSE: CCD), setting that business free to go off and execute a strategy built around the MVNO offering as a key growth engine. Blu Label has retained a stake of 49.47% in Cell C. This is below the threshold for control, so the stake will be equity accounted going forwards.
This will do wonders for the simplification of Blu Label’s financial reporting, but we aren’t quite at that point yet. They’ve had to recognise significant accounting losses related to the restructuring.
To mitigate that pain and to show the market that there’s a business underneath all this, Blu Label has resumed interim distributions by declaring an interim dividend of 43.56 cents. At least this gives the market a base to work with.
On the subject of bases, revenue was a neat R5.0 billion and gross income was R1.35 billion. EBITDA came in at R535 million, so the EBITDA margin is north of 10%. Headline earnings came in at R398 million, or a margin of around 8%.
In terms of group prospects, one of the major growth initiatives is BluEnergy, which has secured a multi-year energy trading licence from NERSA. They are looking to play in the renewable energy space, so that’s going to be one to watch.
The share price closed 12% higher on the day, perhaps because the market can finally understand more of the numbers?
I’m keen to get your views on this one. Please participate in the poll below:
A short and sweet trading update at Fortress Real Estate (JSE: FFB)
Mid-teens growth is the order of the day
Fortress Real Estate has given the market a brief update on the expected earnings for the six months to December 2025. The announcement may be devoid of additional commentary or management narrative, but at least they give a precise number.
Shareholders can expect a dividend per share of 87.89 cents, representing an increase of 15.4% year-on-year. The share price is up 36% in the past 12 months.
Hammerson has grown its earnings in the UK market (JSE: HMN)
6% dividend growth in pound sterling isn’t a bad outcome at all
UK property fund Hammerson has released results for the year ended December 2025. Like-for-like net rental income growth of 3% got things off to a good start on the income statement, with EPRA earnings growth of 5% by the time you work through the expenses. As for the cherry on top, dividend growth was 6%.
That might not sound exciting, but you need to remember that this is a hard currency return. And although there are a lot of valid concerns about the UK economy at the moment, the pound has proven to be a lot more resilient than the US dollar.
The portfolio value increased by 33% through a combination of acquisitions, growth in rentals and compression in valuation yields. They had record leasing activity and strong positive reversions in leases. Occupancies sit at 96%, so the Hammerson portfolio is doing well overall.
The flagship portfolio increased footfall by 2%, with the fund highlighting a “best and the rest” trend that is making it increasingly important for investors to look for quality retail properties. I agree with this sentiment, particularly in this omnichannel retail world.
The loan-to-value (LTV) of 39% is on the high side by South African standards, but the UK benefits from a lower cost of borrowing than we have here. This encourages funds to run at higher debt levels.
It looks like a solid set of numbers overall, with Hammerson up 23% in the past year.
Well, the market didn’t like something about the Motus update (JSE: MTH)
But I thought it looked pretty good overall
Motus has a diversified business in the automotive space. It’s worth giving you that context before we dive into the numbers.
In Import and Distribution, they have approximately 15.5% passenger vehicle market share in South Africa, powered by exclusive import rights for big brands like Hyundai, Kia and Renault (amongst others). This generates 17% of group operating profit.
In Retail and Rental, they then expand the offering to represent 29 OEMs and 38 brands across a footprint of 337 dealerships in South Africa. This takes their market share in new passenger vehicles to 18.4%. This is also where you’ll find their UK and Australian businesses. This is the biggest segment, contributing 40% of group operating profit.
Mobility Solutions is the value-added and financial products piece of the business. Despite generating just 2% of group revenue, this segment is responsible for 22% of group operating profit.
And finally, the Aftermarket Parts business gives them ongoing economic participation long after the customer has driven out in a new car. This segment has operations in South Africa, the UK, Asia and Europe, contributing 21% of group operating profit.
Does this give them enough flexibility and resilience to defend against the incursion of Chinese and Indian vehicles? With the share price up 11.6% in the past year and a juicy dividend yield as well, it seems that way. But despite releasing what I thought were solid interim results for the six months to December 2025, the share price closed 4.4% lower.
Revenue for the period increased 3% and operating profit was up 8%. With net finance costs coming down by a significant 23%, they managed to achieve a lovely jump in HEPS of 19%. The dividend was even better, up 25% year-on-year.
The real joke is cash flow from operating activities, which was up more than 10x from R186 million to over R1.9 billion.
Net debt to EBITDA improved from 2.1x to 1.5x, so that’s another highlight in the numbers.
Motus is certainly enjoying the improved new car sales in South Africa, with operating profit up 15% in the home market despite so much activity in the so-called emerging brands. The UK market also achieved some growth in vehicle sales. Although Australia’s economic growth has been revised downwards, that market achieved a new all-time high in vehicle sales.
I can’t see an obvious reason why the market didn’t like these numbers, so it could just be profit-taking by investors and punters. With the most diversified model of the automotive-focused players on our market, Motus should weather the storm of disruption in this sector.
Mustek’s profits have jumped off a low base (JSE: MST)
Revenue fell by 2.4%, yet HEPS is up 256%!
Just like people, income statements come in all shapes and sizes. Mustek’s results for the six months to December 2025 are a great example, with revenue dipping by 2.4% and profits up sharply.
The profit boost didn’t come from the gross profit margin, as that contracted from 13.9% to 12.6%. EBITDA was down by 1.6%. Nothing about this sounds like it should be boosting HEPS!
When you reach the net finance cost, you find the reason for the HEPS move. Net finance costs fell from R83 million to R48 million. Compared to EBITDA of R128 million, that’s a big difference. This is why net profit increased from R13 million to R45 million.
This boosted HEPS from 23.47 cents to 83.54 cents. The huge percentage move has been driven by a reduction in finance costs, along with the low base for earnings in the comparable period.
Shaftesbury continues to celebrate London’s West-End (JSE: SHC)
Dividend growth looks exceptional
Shaftesbury released results for the year ended December 2025. They are excellent to say the least, with the fund’s West End-focused strategy in London working beautifully.
Much as your social media feed may try to convince you that London is now a hellhole, the reality is that it remains a beautiful and incredibly important city that attracts people from all over the world. The West End is one of the best areas in the city, so that’s a good place to own property.
The portfolio valuation increased by 6.2% on a like-for-like basis, reflecting the underlying appeal of the area. Another indication of success is the leasing activity, with rentals coming in 13.9% ahead of previous passing rents (this is how UK funds talk about reversions).
With underlying earnings per share up by 12%, this is an impressive double-digit growth performance in hard currency. Oddly enough though, under the HEPS rules, earnings actually dipped from 3.4 pence to 3.3 pence per share.
The dividend is what investors will focus on though, up by an excellent 14% year-on-year. Shaftesbury shareholders just might treat themselves to a West End shopping spree!
Earnings almost doubled at Valterra Platinum (JSE: VAL)
The same certainly can’t be said for the dividend
Valterra Platinum released results for the year ended December 2025. Revenue increased by 7%, which sounds like a modest improvement. It was enough for adjusted EBITDA to jump by 68%, and for HEPS to increase by a casual 98%.
Yes, they nearly doubled earnings off revenue growth of just 7%!
And to add to the weird shape of the numbers, the dividend per share is down 37% year-on-year. Hmmm.
If you’re wondering why revenue growth wasn’t higher, you aren’t alone. After all, the PGM basket price did amazing things in 2025 – Valterra’s average realised basket price for PGMs increased 26% in rand. The flooding in Amandelbult took the shine off things unfortunately, driving a 10% decrease in PGM production. Refined PGM production fell 13% and sales volumes were down 15%. This is why revenue wasn’t nearly as high as you might expect.
They delivered cost savings of R5 billion though, so that helped create a decent outcome for earnings. It’s also worth noting that they received R2.3 billion in flooding-related net insurance proceeds, reducing the impact of that irritation and boosting earnings without a related increase in revenue.
With a net cash position of R11.5 billion, they’ve really turned things around from the net debt position at 30 June 2025. This does raise further questions about the move in the dividend, though. I know that the company’s demerger from Anglo American (JSE: AGL) would’ve affected comparability, but still.
Guidance for 2026 remains unchanged, with refined production guidance of 3.0 – 3.4 million PGM ounces. They achieved 3.4 million ounces in 2025, so the midpoint of guidance is actually a decrease from current levels.
At least capex guidance has been moderated by a couple of billion, coming in at R17 billion – R18 billion. This should help free cash flow.
The business is in much better shape than in early 2025, as evidenced by the share price doubling over the past six months. It’s just a pity that the dividend hasn’t kept pace with the earnings growth, with the company taking a more measured approach to lock in the balance sheet strength.
Nibbles:
Director dealings:
Here’s something you won’t see every day: the CEO of PPC (JSE: PPC) funded R5.6 million worth of tax liability (related to share-based payments) using a one-year term loan. He’s pledged shares worth R15.6 million against this debt. If that isn’t a show of faith in a company, I don’t know what is.
An associate of a director of Goldrush Holdings (JSE: GRSP) bought shares in the company (and entered into CFDs) worth nearly R158k.
An associate of a director of Visual International (JSE: VIS) sold shares worth R38.6k.
Here’s something interesting: iOCO (JSE: IOC) announced that Dennis Venter has resigned as the co-CEO of the group. This leaves Rhys Summerton as the sole CEO. I’m never a fan of co-CEO structures, so I don’t see this as a bad thing.
Back in December, Mahube Infrastructure (JSE: MHB) released a firm intention announcement regarding an offer by Sustent Holdings. The circular is expected to be released in early March. But here’s an interesting development: the company has announced that an entity named Bunter Capital (and related parties) has built up an interest of just over 10%. One has to wonder about the chess moves in the background.
Labat Africa (JSE: LAB) has renewed the cautionary announcement regarding negotiations with an AI and technology company operating in the SADC region. The parties are still finalising the terms of whatever this deal might be. As always, there’s every chance that the talks just fizzle out, hence the need for shareholders to be cautious.
Shuka Minerals (JSE: SKA) announced encouraging results from recent samples at the Kabwe Zinc Mine. This is surface testing that sounds like it used rather rudimentary methods to conduct, but it gets the job done – the company feels good about the significant material available at the surface. Testing at the surface is surely cheaper than testing the metallurgical characteristics of the ore body much further down.
Africa Bitcoin Corporation (JSE: BAC) announced that Buyisiwe Makunga has resigned as a director and Chair of the Group Audit and Risk Committee. The company stresses that this isn’t because of governance concerns, but rather a conflict of interest in a business opportunity. I’m sure that’s true, but the timing is still unfortunate based on the precipitous drop in the bitcoin price and the rebrand of the group.
African Rainbow Minerals released a trading statement for the six months to December 2025. This was triggered by the move in earnings per share, which jumped by between 65% and 75% thanks to the profit on disposal of Sakura and a gain on remeasurement of the 50% in Nkomati Mine.
But what the market really cares about is HEPS, which increased by between 5% and 15% (not enough to trigger a trading statement). That suggests 10% at the mid-point, or just enough to be considered double-digit growth.
African Rainbow Minerals has various underlying interests, with PGMs as the highlight in this period. Investors will have to wait for 6th March to see how underlying operations performed.
Altron gives more details on a strong performance (JSE: AEL)
They are focusing on annuity opportunities that have higher margins
Altron believes that the year ending February 2026 marks the end of its “Accelerated Growth” strategy. They are now in “Transformative Growth” mode. These concepts always smell strongly of Eau de Management Consultant, but they are important for getting internal alignment in organisations that are going through change. Managing large groups of people who have different incentives isn’t easy.
Altron’s efforts are paying off though. Earlier this month, they released a trading statement that flagged growth in HEPS from continuing operations of more than 30%. In a voluntary operational update, they’ve given more details on how they got there.
It’s worth noting that HEPS from continuing operations for the first half of the year was up 22%, so they came into the second half with great momentum.
It’s also good to note that the discontinued operation is Altron Nexus, which was sold on 1 August 2025.
Double-digit EBITDA growth certainly helps, as does the low-to-mid-teens growth rate in operating profit (if you exclude the change in Netstar’s depreciation policy that distorts comparability).
The Platforms segment is doing the heavy lifting, with 45% of group revenue and around 90% of EBITDA and operating profit. This is clearly where you’ll find the best margins and a number of annuitised revenue streams.
Within Platforms, Netstar’s growth (mid-to-high teens EBITDA, and high-teens operating profit excluding the depreciation change) has been driven mainly by the South African business, as Australia’s recovery has been slower than anticipated. Altron FinTech is also in Platforms, achieving improving margins and high-twenties operating profit growth. Altron HealthTech, the third pillar in Platforms, achieved high-teens operating profit growth.
In IT Services, they struggled with a drop in revenue. The segment also clearly runs at a much lower margin. Altron Digital seems to be the biggest headache, but at least it was profitable in December 2025 and January 2026 after cost-cutting measures. Altron Security achieved double-digit revenue growth and operating profit growth in line with the interim performance. Altron Document Solutions achieved more than 30% growth in operating profit for the year, so that’s an example of where turnaround strategies can work.
Overall, annuity-based income is up to 65% of total revenue (both segments have this type of income). This gives great visibility on cash flow and helps with the valuation as well.
Double-digit growth in net operating income at NEPI Rockcastle (JSE: NRP)
They’ve hit the top end of revised guidance
NEPI Rockcastle released results for the year ended December 2025. Distributable earnings increased 6.7% and net operating income was up 11.2%. Tenant turnover across the Central and Eastern European portfolio increased by 3.6% on a like-for-like basis, while retail occupancies were up at 98.8%.
As you can see, there’s a good story to tell here – at least if you own dominant shopping centres in the region.
On a per-share basis, the growth isn’t quite as exciting. Distributable earnings per share increased by 3.1% for the year. When you keep issuing new shares, this is what happens.
Another important metric is like-for-like net operating income growth, which excludes acquisitions completed in 2024. Growth of 4.4% on this basis gives you a good idea of why distributable earnings per share growth was in the low single digits.
The fund welcomes Marek Noetzel as the new CEO on 1 April 2026. He takes the reins of an iconic property fund with a loan-to-value ratio of just 32.8%, below the 35% strategic threshold. That sounds to me like a good opportunity to hit the ground running.
Octodec will offload Killarney Mall for almost R400 million (JSE: OCT)
This is only slightly below the book value
Hot on the heels of a general operating update that dealt with Octodec’s portfolio and many of the unique challenges that they need to manage on a daily basis, the company has now announced that they have a buyer for Killarney Mall. With a relatively high vacancy rate, the new owner (AJPH Property) will have some work to do.
For Octodec shareholders, this means an exit from this asset at a price of R397.5 million. It remains subject to adjustments for working capital. This price is only slightly below the valuation of R407.6 million that was performed with an effective date of 31 August 2025.
Selling at a premium to book is obviously preferred, but companies need to sometimes get out and move on to new assets. It looks like Octodec is making a sensible decision here, with the proceeds being used to reduce debt and deploy into future projects.
RCL has given tighter guidance for a tough year (JSE: RCL)
As previously noted by the company, the pressure is in sugar
At the start of this month, RCL released a trading statement for the six months to December 2025. It noted an unpleasant drop in HEPS from total operations of at least 25% (or a decrease of at least 27.4 cents).
Most of this move (at least 21.8 cents) was thanks to the troubles in the sugar industry, with the stronger rand and ineffective sugar tariffs placing the local industry under even more strain. An additional issue for the year-on-year HEPS comparability is that there was a partial recovery of the sugar levy in the prior period. In more positive news, the initial trading statement noted that Groceries and Baking were expected to report improved underlying profitability.
We now have a further trading statement that gives a tighter range. HEPS from total operations is now expected to drop by between 29.2% and 32.1%.
Kudos to the company for keeping investors informed – an initial trading statement and subsequent further trading statement shows commitment to the market. It’s just a pity that the numbers have gone the wrong way.
Redefine’s pre-close update is full of nuggets (JSE: RDF)
Perhaps the most interesting is that large retail centres are doing well
Redefine Properties released a pre-close update dealing with the six months to February 2026. There’s a bullish narrative overall, with the company believing that they are in the strongest position they’ve been in during the post-pandemic period. Property fundamentals are showing positive signs and the balance sheet is in good shape, so they can take advantage of the opportunities out there.
But what do the numbers say? Well, in South Africa, negative rental reversions of -6.3% are worse than -5.2% in FY25. Renewal success rates are up though, so perhaps they are being slightly less strict on price in order to get the leases across the line.
The weighted average lease escalation of 6.4% is well above inflation in South Africa, although one must remember that property funds don’t deal with the CPI basket. They face municipal charges, as well as security, energy and other costs that tend to run above CPI.
Speaking of energy, Redefine’s solar projects generated 13.1% of the total energy demand in this period. They’ve invested heavily across the retail, office and industrial portfolios.
In the retail portfolio, Redefine notes that large-format centres have recovered. Turnover growth is now in line with convenience centres. Positive reversions in the retail portfolio of 2.4% were ahead of 1.0% in FY25. This is probably the bright spot in the update.
The office portfolio is where things got nasty. Reversions were -16.8%, even worse than -12.9% in FY25. This can be very lumpy though, with Redefine expecting it to moderate to -11% by the end of the year. Interestingly, of the 95 renewals in the period, 28 had negative reversions and 53 had positive reversions. The large tenants have the best bargaining power, as you might expect.
The industrial portfolio achieved positive renewals of 3.7%, up from 0.8% in FY25. This has been a solidly performing property asset class in South Africa.
In Poland (the EPP portfolio), like-for-like footfall increased by 0.8% and like-for-like turnover was up just 0.5%. Retail occupancies were steady at 98.2%, while office fell from 84.2% to 82.9%. At least rental reversions were up to 1.9% vs. 0.4% in FY25. In the ELI portfolio in Poland, which has the logistics assets, rental reversions were 1.8% – significantly lower than 6.9% in FY25.
They are looking to dispose of a number of assets in Poland as part of a broader plan to simplify the joint ventures in that country. They are also looking to build a strong self-storage platform in the country, taking advantage of trends like urbanisation and eCommerce.
Looking at the balance sheet, the group weighted average cost of debt has been maintained at 7.0%. There are various refinancing negotiations underway, with one of the primary goals being to address the maturity concentration risk in FY28. The loan-to-value (LTV) of 41.4% (calculated in line with the covenant of 50%) is in a healthy space. The see-through LTV of 47.2% is in line with what we’ve seen in recent years.
Overall, for FY26, they think that the upper end of the 4% – 6% guidance for growth in distributable income per share is in play.
Super Group pulled off an exceptional interim period (JSE: SPG)
Leaning into Chinese and Indian cars has worked
If you’re going to panic, panic quickly. This is some of the best advice you can ever be given. Instead of clinging to a sinking ship, get yourself onto something else as quickly as possible.
Super Group is proof of this, with the share price closing 5.4% higher thanks to the group achieving great interim numbers. Revenue was up 7% and operating profit increased by 8.7% as margins improved. By the time you reach HEPS from continuing operations, you find a fantastic outcome of 28% growth.
Cash generated from operations increased by 39.4%, so these results aren’t just pretty on paper. They are pretty in the bank account as well.
To understand the numbers, we need to dig into the segments.
The Supply Chain segment grew revenue by 6.3% and operating profit by 14.9%. This is the largest segment in the group, with operating profit of R695 million. The highlight within the segment was surely Ader in Spain, with revenue growth of 17.2% and EBITDA up by a rather ridiculous 225.6%. This is what can happen in low margin businesses when revenue heads in the right direction. Another useful outcome in this segment is that the cross-border transport business achievied a 90% reduction in trading losses.
Fleet Africa grew revenue by 15.3%, but operating profit could only manage a 4.2% increase due to pressure on margins from lower rental volumes. Operating profit was R156 million in this period.
Dealerships SA certainly deserves a mention, with the company leaning into Chinese and Indian brands for growth. 29.7% of new vehicle sales volumes are attributable to these brands, as Super Group’s volumes in this space more than doubled year-on-year. The profile of cars on our roads is changing dramatically. Operating profit improved from R193 million to R209 million, an excellent change in trajectory.
Dealerships UK managed to achieve a decent performance in Ford, while also taking advantage of the new Chinese brands. Operating profit growth jumped by 50.4% to R62 million thanks to the initiatives in this space. But I must point out that operating profit is at roughly half the levels we saw in interim 2024.
The discontinued operations still have some tough areas, like UK automotive logistics that is exposed to the broader automotive manufacturing environment in the UK and Europe (which is in enormous trouble). They are also looking to sell the UK KIA dealerships, having shut Hyundai and Suzuki. I’m old enough to remember when the new South Korean brands (KIA and Hyundai) were the disruptors rather than the disruptees.
Kudos to the group – they changed what needed to be changed. There’s a lesson in here for all of us about the importance of not ignoring disruption.
Give me your views on where the automotive sector is headed:
Nibbles:
Director dealings:
An associate of a director of Dis-Chem (JSE:DCP) bought shares worth R1.45 million.
A director of a major subsidiary of Stefanutti Stocks (JSE: SSU) bought shares worth nearly R45k.
Incoming CEO Magen Naidoo has bought another R9.6k worth of shares in Mantengu (JSE: MTU).
The Competition Commission has given Transpaco (JSE: TPC) a bloody nose. The regulator has prohibited the acquisition of Premier Plastics, a deal that was announced on 6 November 2025. Premier produces retail plastic carrier bags, so there’s immense overlap with Transpaco’s existing business. This is why the regulator wasn’t so keen on this R128 million transaction. Transpaco is considering its options based on the commission’s decision.
Reunert (JSE: RLO) announced that incoming CEO Anthonie de Beer will be appointed as an executive director from 1 March 2026.
Marshall Monteagle (JSE: MMP) concluded a rights offer back in November 2025 for $10.7 million. The raise was significantly oversubscribed, leaving many unfufilled excess applications. The company then used its general authority to issue shares, in order to give those applicants the opportunity to apply for new shares. This has led to an additional issue of shares worth $2 million.
Numeral(JSE: XII) is trying to raise R100 million (a large number). With only a partial underwrite of roughly R32 million, they are looking to close a huge gap. I’m not surprised to see that the closing date for this offer has been extended all the way out to 31 August 2026. This isn’t the kind of thing you see when people are queueing up to invest.
Blu Label (JSE: BLU) announced that Lindsay Ralphs, who previously served as the CEO of Bidvest (JSE: BVT), will be appointed as independent director and chairman designate with effect from 24 February 2026.
In case you were holding your breath, which I’m sure you weren’t, Trustco (JSE: TTO) has renewed the cautionary announcement regarding the potential delisting from the JSE. This is based on their ongoing assessment of the Simplified Listings Requirements.
Profits and cash flows look better at Aveng (JSE: AEG)
The order book has softened though
In construction, due to the immense pain that a bad contract can inflict, it’s possible to see profits improve substantially despite a drop in revenue. In fact, revenue can be a poor predictor of profitability, which is why I completely avoid investing in this sector.
We see this come through in Aveng’s results for the six months to December 2025. They reflect a drop in revenue from R16.6 billion to R14.2 billion, yet operating earnings swung beautifully from a loss of R356 million to profit of R107 million.
Even though infrastructure markets have softened in Australia and New Zealand, gross margin improved from 2.7% to 5.6% as the quality and implementation of projects improved. There’s also the substantial impact of the Jurong Region Line (J108) project in Southeast Asia and the Kidston Pumped Storage Hypro project in Australia, with combined losses of A$20.2 million in this period vs. A$76.7 million in the prior period.
Like I said – revenue is a poor predictor of profitability!
Aveng has recognised the forecast costs to complete those projects in this period, but the associated cash flows will be in the second half of FY26 and in FY27. It’s worth noting that cash on hand improved from R3.1 billion to R3.4 billion in this period.
Headline earnings came in at R4 million. That might not sound like much, but the comparable period was a loss of R399 million. At least they are back in the green, albeit only just.
There are other difficult contracts in the group as well, like the Tshipi project. Aveng is negotiating commercial settlements with various clients, with David Simpson appointed as the interim group CEO to focus on commercial resolution and delivery of underperforming projects. At the Moolmans business, Pieter van Greunen has been appointed as managing director, with the resolution of the Tshipi contract as one of the key focus areas.
The group heads into the second half of the financial year with work in hand of R38.6 billion, up from R37.5 billion in the first half. But it seems like success depends as much on resolving the legacy projects as it does on the new stuff.
And as a reminder, after a lot of work went into figuring out what to do with McConnell Dowell, Aveng has decided to keep that that business for now.
Clientèle’s numbers are complicated (JSE: CLI)
But they do seem to be heading in the right direction
Clientèle has released a trading statement for the six months to December 2025. Based on the JSE rules, the release of such an announcement immediately tells you that the numbers differ by at least 20% vs. the prior period. In this case, the percentage move is a lot bigger!
But we need to deal with some issues that are impacting the comparability of numbers.
One of the major distortions in the numbers is the bargain purchase gain of over R400 million related to the acquisition of 1Life. This is excluded from HEPS, which gives me a good opportunity to remind you that HEPS is the number that the market uses to actually judge performance.
Here comes another distortion that does impact HEPS though: a change to the application of IFRS 17 that led to a restatement of the interim results for the six months to December 2024. That may sound like a long time ago, but remember that this impacts the base period of comparison for the six months to December 2025.
But perhaps the biggest distortion of all is that Emerald Life has been consolidated for the first time in the latest numbers. This has resulted in HEPS increasing by between 92% and 112% vs. the previously reported numbers, a sizable jump that is essentially a doubling of HEPS at the midpoint of that range. After the base period was restated for IFRS 17, the expected increase in HEPS is between 43% and 63%.
There are a lot of adjustments to consider here, but the direction of travel is up.
Gemfields flags decent pricing for fine-quality rubies (JSE: GML)
But the lower-quality stuff is under pressure
Gemfields announced the results of a mixed-quality rough ruby auction held from 9th to 20th February. This is the auction that was deferred from December 2025. The auctions are always difficult to use to establish a trend, as the quality of the stones varies from one auction to the next.
In this case, they achieved auction revenue of $53 million, having sold 90% of the lots offered for sale and 88% of the carats offered for sale. The average price was $279 per carat.
Although fine-quality rubies attracted decent prices, management has indicated that other qualities were more “muted” due to the uptick in product on the market from illegal mining networks, along with weaker demand from China. The products may be beautiful, but it’s still a tough space to operate in.
Notably, this is the first auction that includes material from MRM’s second processing plant.
If we look at previous auctions over the past few years, the price per carat at this auction is the lowest that we’ve seen. Although Gemfields notes that this is because lower quality rubies weren’t offered at those auctions, the reality is that pressure on the average price per carat can’t be good news for shareholders. I doubt it’s much cheaper to extract a lower quality ruby vs. a high quality ruby, so the price per carat is still relevant to profitability.
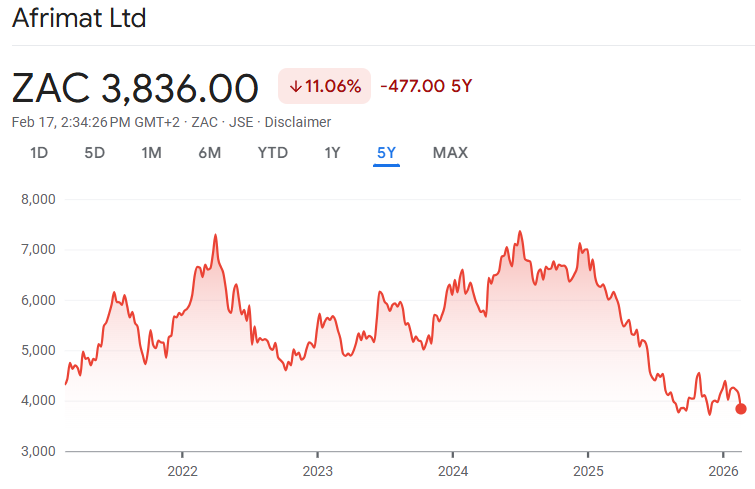
Mr Price is ready to close the NKD deal (JSE: MRP)
Based on the lack of share price recovery, the market still doesn’t like it
A chart of the Mr Price share price makes it depressingly easy to see exactly when they announced the NKD acquisition. You’re looking for the precipitous drop in late 2025 that looks like someone threw the share price off the side of a cliff:
You may also note that the share price hasn’t really staged a recovery yet. Some efforts earlier this year to address the anger in the market stemmed the bleeding, at least, but there’s little doubt that the market is still angry about the deal.
Mr Price has gone ahead with the deal anyway, with the latest update being that all regulatory conditions have now been fulfilled. The deal is therefore subject only to the money actually changing hands. They are targeting a scheduled closing date of 31 March 2026.
In yet another effort to try to get the market on the same page as management here, there is an investor presentation scheduled for 17 March. I’m not sure how they will try to tell a better story that time around, but perhaps some pleasantly surprising nuggets will be shared.
Nedbank secures an important regulatory win in the NCBA deal (JSE: NED)
They have received an exemption from making a mandatory offer
In January this year, Nedbank announced an intention to acquire a 66% stake in NCBA Group, a major financial services operation in East Africa. Nedbank is well behind its peers when it comes to the African growth story, so this feels a bit like a game of catch-up.
To pay for the deal, Nedbank is using 20% cash and 80% new shares in Nedbank. The deal is worth a substantial R13.9 billion, so it’s not surprising that they can’t do a transaction of that size purely in cash.
An important component of the deal is that the remaining 34% of shares in NCBA will continue to trade on the Nairobi Securities Exchange. This makes the deal a manageable size for Nedbank, while giving them control via the 66% stake. Companies like to buy control, but not necessarily 100% of the earnings.
But in the event of needing to do a mandatory offer, Nedbank was prepared to switch the structure to an offer for 100% of the shares. This tells me that they want either 66% or 100%, but preferably nothing inbetween.
They don’t need to follow this route though, as the takeover law regulator in Kenya has provided the exemption from the mandatory offer, so 66% it shall be.
Another element to the transaction is that this is a pro-rata offer to shareholders, which also allows for excess applications for those who want to sell more than 66% of their shares to Nedbank (to make up for others who may not want to sell). Nedbank has received irrevocable undertakings to accept the offer from holders of 77.54% of NCBA shares in issue.
Octodec affirms guidance – but this portfolio sounds like hard work to manage (JSE: OCT)
Inner-city properties come with a host of challenges
Octodec might begin with a bullish narrative in its pre-close update for the interim period, but it quickly becomes clear that managing their property portfolio is anything but easy.
In an update that covers the five months from 1 September 2025 to 31 January 2026, the Johannesburg residential portfolio is one of the more obvious challenges. Octodec highlights the pressure on landlords to provide alternative solutions to failing council service delivery and infrastructure. Tenant affordability is another challenge. Nothing about this sounds particularly encouraging for rental yields.
On the plus side, at least the retail portfolio around Lilian Ngoyi Street has improved after the damage from the gas explosion was finally fixed. The Joburg CBD really is an example of how to play the property game on hard mode.
The overall retail shopping centre portfolio had a vacancy rate of just 0.2% as at the end of January 2026, which is better than the 0.5% reported for August 2025. The ugly duckling is Killarney Mall, currently held for sale with a vacancy rate of 17.7% at the end of January (in line with August). The launch of a Regus shared-office space at Killarney is expected to improve footfall.
The collection rate is largely okay, although they do highlight that one of their tenants is in business rescue.
Despite the portfolio being a tricky thing to manage, Octodec has plenty of experience in this space and the risks are well diversified. This has enabled them to raise debt at reasonable rates, with refinancing of maturing debt on improved commercial terms also being possible.
It also make a big difference that the loan-to-value ratio is on the right side of 40%, with disposals of nine non-core properties during the five months (for a total of R81.2 million at a 3.7% premium to book value) helping to achieve this outcome. Unutilised facilities increased from R675 million to R1 billion, so they have decent headroom on the balance sheet.
The goal is to get to 35% in the long term, achieved through further disposals of smaller properties in the portfolio. They also need to fund various capex projects of course, including the ongoing Gezina City project.
The weighted average cost of debt is down to 8.8% at the end of January 2026, an improvement from 9.1% in August 2025. This is thanks to the refinancing activity, as well as the lower overall interest rates.
Guidance for the year ending August 2026 has been affirmed, with expected growth in the distribution per share of between 0% and 4%. That’s not much, but at least it’s in the green.
Earnings fall at Sasol, but at least free cash flow is up (JSE: SOL)
Growth remains hard to come by
Sasol’s share price is up 62% in the past year. But for the six months to December, HEPS has fallen by 34%. Markets can be confusing things, especially for the likes of Sasol where the valuation is low and the the share price performance will depend on just how much bad news actually materialises.
With flat turnover (despite a 3% increase in volumes), Sasol’s adjusted EBITDA fell by 12%. Production volumes at Secunda Operations were up 10% and this no doubt informed some of the share price action, but the macro environment is still working against Sasol. The average rand price of oil fell 17%. Even the price of chemicals (in US dollar per ton) dropped, with the rand strength against the dollar putting further pressure on the translation of the international chemical results.
Capital expenditure fell by 43% to R8.5 billion, so free cash flow generation actually improved dramatically thanks to this. Free cash flow for the period was R0.8 billion vs. -R1.3 billion in the comparable period.
On a market cap of R89 billion though, R0.8 billion in free cash flow isn’t exactly an exciting yield (even if you annualise it).
Here’s the real kicker though: this is actually the first positive interim free cash flow for four years. When you’re used to dry bread, a piece of toast with butter can feel gourmet. I just wish that the butter was coming from improved cash flow from operations, rather than a drop in capex.
With net debt to adjusted EBITDA of 1.6x, the balance sheet is in reasonable shape. EBITDA can change quickly though, so this ratio is always at risk. Debt was brought down from R103.3 billion to R93.5 billion, so that’s an encouraging sign.
In terms of updated guidance, the dip in capex is expected to stick. They reckon that capex for the year will be R2 billion lower than previous guidance of R24 billion – R26 billion. Alas, the International Chemicals adjusted EBITDA is revised lower to between $375 million and $450 million, well off the previous level of $450 million to $550 million. This is a decrease in adjusted EBITDA margin, to between 8% and 10% vs. previous guidance of 10% to 13%.
Will they ever recover from the catastrophic SAP implementation?
SPAR is such a good example of how the success of your local franchisee can be a terrible indication of the health of the franchisor. We’ve all shopped at a SPAR that we know and love, with a great deli and a product assortment that makes it unique in the local community. Yet for all the effort that goes into making that happen by the franchisee, we have a scenario where the holding company performance looks like something revolting that got cleaned out of a grimy corner of the storeroom.
Part of the problem is that the franchisees aren’t required to buy everything from the franchisor. In other words, SPAR as a wholesaler must compete with other suppliers to the stores. You would imagine that this is a no-brainer, as SPAR is surely the most efficient and obvious supplier to the stores. After all, they send one truck from the distribution centre that has everything on it.
Right? Well…
What happens when the distribution centre implements a new system in a way that is disastrous even by oh-no-this-retailer-is-going-with-SAP standards? And what happens when they do it in their traditionally-strongest regional market?
Also, what happens if that same company runs around in Europe dealing with problems elsewhere, instead of focusing on the home market?
Here’s what happens:
I actually have a small speculative position here, based on a thesis around believing that it would be difficult to fully destroy a brand that is part of the fabric of community retail in South Africa. I’m now wondering about whether it is so difficult after all.
CEO Angelo Swartz has decided to throw in the towel. He’s only 43 years old based on the SPAR website, yet this turnaround managed to burn him (and his family) out. That tells you something about how bad it actually is.
Reeza Isaacs is taking the top job, hopefully bringing some stability to the story. Megan Pydigadu moves from COO to CFO to replace Isaacs. And based on the latest trading update at the company, they have a lot of work to do.
For the 18 weeks to 30 January 2026, SPAR’s wholesale turnover from continuing operations was up just 2.1%. To make it even worse, their gross margin fell, which means they could only achieve this number through highly promotional activity to drive sales.
SPAR Southern Africa? Growth of just 0.9% – a shocker. Within that, Grocery & Liquor was just 0.8% (exceptionally poor), Build it fell 2.4% (also poor, but a tricky business) and SPAR Health was up 23.0%. Perhaps all the accountants looking at these numbers were at least buying their headache tablets internally.
In Ireland, growth was 3.1% in local currency and 6.1% in rand. This helps bring the group number up to the 2.1% noted above. Yay.
With internal selling price inflation of 2.6% in Grocery & Liquor, they suffered a negative move in volumes despite all the promotional activity. Although they try and make things sound better by referring to 2.3% overall growth in November to January (i.e. excluding a soft October that dragged them down to 0.8%), even the “better” number is actually very weak.
Another example of clutching at straws is to describe the high-income segment as showing a “modest recovery” with like-for-like growth of 1.6%. Modest, indeed. Compare this to Checkers and Woolworths Food, and you’ll quickly see just how bad SPAR is.
Retailer loyalty is the way they measure the extent to which franchisees procure from the wholesaler. Loyalty in KZN is at just 71.5% vs. 84% for the rest of South Africa, reflecting the immense hangover of the SAP implementation that left retailers stranded for stock. There’s even litigation around this, with claims related to the SAP implementation and how it affected the claimant. The initial claim was R5 million and the litigation “significantly exceeds” that amount. Other than the claimant and one other retailer, all KZN retailers have reached settlements with SPAR.
You can’t just stop a SAP process along the way. To get the full benefits, they need to finish the project. They talk about a risk-mitigated revised plan to finish the project.
My long-standing joke remains undefeated: Ernie Els is the only truly successful SAP implementation story.
The group has reiterated that they want to hire a Managing Director for the Grocery & Liquor business in South Africa. I’ll say it again: adding layers of management to the structure is not the answer.
And are they at least done with selling businesses in Europe? Not quite, with AWG in South-West England needing to be sold. I’m going to pull this pearler from the announcement, as it genuinely tells you everything you need to know about SPAR:
“Further, the Group does not anticipate needing to make a cash injection to effect the disposal.”
They are so accustomed to having to pay people to drag their rubbish away that they now need to specifically indicate to the market whether that will be happening again.
They talk about a transaction structure that has been “substantially agreed” for the AWG disposal. Let’s hope they can get it done quickly.
Somehow, against this backdrop, SPAR believes that they might be able to do share repurchases in the next financial year. Getting the authority from shareholders vs. actually being in a financial position to pull the trigger on share repurchases are two different things.
Overall, the company is now a steaming pile of you-know-what. I would’ve loved to buy the dip here, but I think it would be a safer bet to stick to the type that I’ll find in the chips aisle.
But what do you think? Do you believe they can restore SPAR to its former glory?
Nibbles:
Director dealings:
Despite all the positivity around Dis-Chem (JSE: DCP) (or perhaps because of it?), an associate of director Stanley Goetsch sold shares worth R11.2 million.
An associate of a director of 4Sight Holdings (JSE: 4SI) bought shares worth R724k.
Another day, another SENS announcement from ASP Isotopes (JSE: ISO) regarding US subsidiary Quantum Leap Energy. Except in this case, the update actually relates to a South African subsidiary of Quantum Leap Energy! Group structure aside, it relates to an agreement with the South African Nuclear Energy Corporation (Necsa) to collaborate, develop and produce High Assay Low Enriched Uranium (HALEU). This services contract builds on the previously announced memorandum of understanding between the parties. Necsa will provide facilities and infrastructure in Pelindaba, while Quantum Leap Energy will provide proprietary enrichment technology. The world’s energy needs are going through the roof right now thanks to AI data centre infrastructure and general industrial electrification, so ASP Isotopes and its subsidiaries are fully focused on addressing that opportunity.
Telemasters(JSE: TLM) released a trading statement for the six months to December 2025. They have flagged a increase of 94% in HEPS, taking it from 0.35 cents to 0.68 cents. Note: I said 0.68 cents, not R0.68. So although the share price is under R2, it’s still trading on an enormous Price/Earnings (P/E) multiple.
Louis Raubenheimer, son of Raubex (JSE: RBX) founder Koos Raubenheimer, has been appointed to the board of that company as an independent non-executive director. He has plenty of prior experience with the company, having held various roles from 1992 until 2022. His most recent role was running the Roads and Earthworks Division.
The talk in investment markets is that the AI “bubble” may soon burst. Nico Katzke, Head of Portfolio Solutions at Satrix, disagrees with these predictions, though he does caution investors about potential risks.
“In market terms, a bubble means irrational pricing,” he says. “It occurs when hype eclipses reason. Prices then reflect investors’ urgency to buy, as they fear they’ll miss out. This hype pushes prices even higher, reinforcing positive sentiment in a self-perpetuating loop.”
In other words, bubbles occur when asset prices far exceed their sustainable value. This happened with tulip prices in the 1600s (“tulip mania”) and tech stocks in the early 2000s (“dot-com” bubble). Some analysts believe it’s happening to artificial intelligence (AI) shares now.
Katzke is not convinced by that analysis. He points to the 2000 dot-com crash as a lesson from the past that informs the current market. “In the early 2000s, there were naysayers who wrote the obituary for a tech industry that – at the time – looked like it had died before it had even matured,” he says. “A few analysts were saying, ‘We told you so. This was all hype, all bubble, no substance.’ But hindsight shows us that the market was not irrational in valuing highly the companies that would ultimately benefit from widespread internet adoption.”
Instead, the dot-com crash was simply a case of not all tech companies becoming winners. There’s a lesson there for today’s AI companies and today’s investors.
“Markets tend to be remarkably resilient and efficient over time,” says Katze. “The dot-com crash simply preceded an era of enormous stock market growth – particularly in companies that succeeded in the Internet age. Were there failures? Of course. But after the stock market correction, many analysts pointed to the irrational behaviour of companies that were overly enthusiastic about building the internet’s infrastructure, including laying the same fragile undersea fibre-optic cables that have enabled our current era of global connectivity. In hindsight, we’ve come to rely on that infrastructure. And the technology is still here. After all, you’re likely reading this on the internet.”
The long-term market rebound that followed the dot-com bubble of the 2000s highlighted the importance of staying calm and avoiding panic selling. Stock markets truly are the only marketplace where customers flee when there’s a sale. Building long-term exposure to equity markets and remaining invested has been shown to deliver long-term value.
Katzke recommends adopting a cautious but open-minded approach to the current AI bull run. “Will there be pain from AI? More than likely. Some companies may disappoint. Others will fail entirely. Are valuations stretched today? I would incline to agree, but at the same time, I would point out that traditional accounting measures aren’t great at measuring the value of technology companies,” he says. “Even though markets will likely remain volatile for some time to come, investors should not forego long-term investment discipline due to short-term uncertainty.”
Like AI, other assets – such as cryptocurrencies, commodities and resource stocks today – also face “bubble” warnings. “It’s not helpful to label everything a bubble,” says Katzke. “All that does is create fear among investors, who then view those industries or stocks as being irrationally priced. This fear affects behaviour, and investors remain on the sidelines without a sober consideration of the long-term risk/reward trade-offs in investing in an asset class.”
Instead, he suggests taking a pragmatic, long-term view of the market. “AI stocks may look expensive today, based on fundamentals, but how relevant are those fundamentals?” he concludes. “Many of these companies are building the infrastructure for tomorrow’s AI-powered world. I would argue that building exposure to companies developing the infrastructure that will power future AI integration is still a sound investment. Here we like the larger, well-diversified technology indices such as the Nasdaq 100 as opposed to smaller, more niche and predominantly software exposed indices.”
Satrix consists of the following authorised Financial Services Providers: Satrix Managers (RF) (Pty) Ltd and Satrix Investments (Pty) Ltd. The information does not constitute financial advice. While every effort has been made to ensure the reasonableness and accuracy of the information contained in this document (“the information”), the FSPs, their shareholders, subsidiaries, clients, agents, officers and employees do not make any representations or warranties regarding the accuracy or suitability of the information and shall not be held responsible and disclaim all liability for any loss, liability and damage whatsoever suffered as a result of or which may be attributable, directly or indirectly, to any use of or reliance upon the information.
Flat EBITDA at Anglo American and a nasty drop in HEPS (JSE: AGL)
Operating cash flow is a highlight, though
Anglo American released results for the year ended December 2025. It didn’t take them long in the announcement to mention copper and the Teck deal, although they didn’t actually refer to it as a “merger of equals” in the opening line!
With a major regulatory approval achieved at the end of 2025, they are making good progress in the Teck deal. Once completed, investors will have more than 70% exposure to copper in the enlarged Anglo group.
They could do with a boost, as underlying group EBITDA had a flat year in 2025, coming in at $6.4 billion vs. $6.3 billion in the prior year. This is despite $1.8 billion in run-rate cost savings that were delivered on schedule by the end of 2025. The “run-rate” reference means that the $1.8 billion may not be fully captured in the 2025 financials.
EBITDA margins were strong in the businesses that Anglo plans to keep, like copper at 49% and premium iron ore at 43%.
But despite this, group HEPS actually fell sharply from $0.72 to $0.39 per share.
The highlight was cash conversion in continuing operations of 107%, as they reduced working capital and unlocked cash to help reduce debt. Along with the proceeds of the sale of shares in Valterra Platinum (JSE: VAL), this reduced net debt from $10.6 billion to $8.6 billion.
De Beers remains an ugly story, with an impairment of $2.3 billion to the value of that asset. It will be a brave soul indeed who acquires De Beers and takes a risk on mined diamonds.
The sale of the nickel business is going through regulatory approvals, while the steelmaking coal business still has an uncertain future (while Anglo searches for a buyer).
Record free cash flow at AngloGold Ashanti (JSE: ANG)
The 2025 dividend is the highest in the company’s history
Are you bored of the record numbers coming through in the gold sector? Or are you invested in this sector and every additional update just feels like another pat on the back?
As you know by now, the gold price did really well in the past year and the gold mining houses have been printing cash. AngloGold has added its name to that celebratory list with the release of results for the year ended December 2025.
Free cash flow tripled to a record $2.9 billion. This magnificent outcome was thanks to strong cost control (total cash costs per ounce increased by 7%, mainly due to higher royalty payments) and a 16% boost in production to complement the higher gold prices.
Total dividends for the year were $1.8 billion, a new record. This represents 62% of free cash flow, which is higher than the typical payout of 50% of free cash flow. But this also shows you that management is retaining plenty of firepower, with capital expenditure having increased by 32% in 2025. Notably, sustaining capital expenditure was up 22%, while non-sustaining (or expansionary) capital expenditure increased by 62%.
They haven’t just been sitting back and enjoying the gold cycle. AngloGold has been busy with acquisitions and disposals, having invested heavily in areas like Nevada in the United States. They’ve let go of non-core assets in riskier markets like Côte d’Ivoire and Brazil.
Production guidance for 2026 is 2.8 million to 3.17 million ounces vs. the 2025 number of 3.1 million ounces. They also expect an 11% increase in the cash cost per ounce, with approximately half of the increase from royalty payments and the other half from inflation.
Dis-Chem accelerates to double-digit revenue growth (JSE: DCP)
They are focused on data and partnerships
Dis-Chem released a trading statement for the 24 weeks from 1 September 2025 to 16 February 2026. The market liked it, with the share price closing 3.9% higher on the day.
This is because Dis-Chem achieved group revenue growth of 10.1% in this 24-week period. To give that more context, the six months to August saw them achieve group revenue growth of 8.7%. An acceleration in growth is always welcomed by the market, with the second half of the year clearly going even better than the first half.
Retail revenue growth was 9.5% in this period vs. 8.3% in the interim period. An increase in the growth rate of 120 basis points is meaningful. Like-for-like revenue growth was 5.7% and volume growth was 5.0%, so there is minimal price inflation in these numbers.
If you dig deeper, the efforts of the “X, bigly labs” team at Dis-Chem seem to be paying off (despite having the most ridiculous name in history that sounds like a Musk-Trump concoction). With better data and a refreshed loyalty programme that was launched approximately 7 weeks into this period, they saw retail revenue in the 17-week period increase by 10.4%. This is encouraging exit velocity that shareholders will like.
The profits are what count though. Achieving better sales is great, but the rewards programme comes at a cost in the form of savings passed on to shoppers. Dis-Chem notes that customers enjoyed R410 million in savings over the 17 weeks. I will be interested to see what the impact on gross margin looks like, with the potential upside surprise being that supplier-funded deals often help to reduce the impact on the retail margins of these programmes.
For now though, Dis-Chem is happy to bank the market share gains. For the 12 weeks to 25 January 2026 (a period measured by NielsenIQ), they achieved volume growth of 8% vs. the market at 1.3%, taking market share across all categories up by 80 basis points.
They are also doing particularly well in areas like GLP-1 drugs, with pharmacy revenue up 13.7% for the 17 weeks under the new rewards programme. Aspen (JSE: APN) shareholders will certainly be interested in this level of GLP-1 adoption.
In the Wholesale business, revenue was up 15.7% in the 24-week period vs. 11.1% in the interim period to August. Sales to own retail stores were up 16.2% vs. 10.9% in the August period. The Local Choice pharmacies increased from 230 stores to 281 stores. Wherever you look, there’s an encouraging acceleration in the business.
This is a seriously impressive performance. A gap has now opened up between the Dis-Chem and Clicks (JSE: CLS) share prices:
Are we witnessing a rerating of Dis-Chem that will stick this time, relative to Clicks at least? Have your say in the poll below:
enX will sell the remaining 75% interest in West African International (JSE: ENX)
Trichem is exercising its option to own the entire thing
Back in March 2025, enX announced that Trichem would subscribe for a 25% stake in West African International (WAI). Trichem then had the option to sell their 25% stake back to enX (a put option), or to acquire the remaining 75% interest in WAI (a call option).
Trichem is clearly happy with the asset, having injected R107 million for the initial 25%. They’ve decided to go with the call option rather than the put option, which means they will acquire the remaining 75% in WAI from enX.
It’s a much bigger deal than you might think, as it triggers a s112 situation for enX. This is because the 75% stake represents the majority of the remaining assets in enX. This puts us into the territory of the Companies Act that is regulated by the Takeover Regulation Panel, hence the exercise of the option by Trichem is actually classified as a Firm Intention Announcement.
It gets even more interesting from a regulatory perspective. As this is just a subsequent tranche of a previously announced transaction, the categorisation calculation that took place at the time of the original deal stills stands. So although it is a s112 from a Companies Act perspective, it’s only a Category 2 under the JSE Listings Requirements.
But they need a circular anyway, not just a terms announcement, as the s112 needs a shareholder vote. They also need to include a fair and reasonable opinion from an independent expert.
It all sounds like useful inspiration for a tricky question in the JSE Sponsor exams!
The call option will be practically implemented as a subscription for shares by Trichem, followed by a share repurchase from enX. The pricing for the subscription was previously set at between R286 million and R407 million, with the calculation based on the underlying net asset value and profit after tax.
Based on the receipt of cash for this tranche, along with the release of cash held in escrow after the first subscription, enX plans to return the majority of the resultant net cash to shareholders. The circular will hopefully give a better indication of what that number might look like.
Local gold and PGM at Sibanye-Stillwater more than doubled EBITDA in 2025 (JSE: SSW)
The day really was darkest before the dawn
Sibanye-Stillwater’s results show you what can happen when you give yourself a chance to get lucky. After many self-help initiatives during the PGM downturn, the business was positioned for an upswing. And boy, did that upswing arrive in 2025.
The results reflect a 14% increase in revenue in 2025. That was good enough to drive a wonderful jump in HEPS of 281%. Talk about a year to remember!
It was also heavily weighted towards the second half, with normalised earnings coming in 377% higher in the second half vs. the first half of the year. The second half contributed 83% of full-year normalised earnings. If they can maintain that momentum, 2026 will be even better.
The balance sheet is in much better shape these days thanks to the improved profits, with net debt to adjusted EBITDA of 0.59x at 31 December 2025.
If we dig a bit deeper, we find that the South African PGM operations generated EBITDA of R16.7 billion, while South African gold generated R12.5 billion. In both cases, those operations more than doubled EBITDA vs. the 2024 levels.
The numbers are excellent elsewhere as well. The US PGM business swung from a loss in 2024 to positive EBITDA of R4.4 billion in 2025. The recycling business generated R4 billion in 2025 vs. just R0.6 billion in 2024. In fact, only the nickel business was in the red in 2025.
It wasn’t all good news in the gold business. The geotechnical issues at Kloof represent just one of the group’s headaches. But when the commodity prices behave like this, it can make up for a lot of other problems.
Spar needs a new CEO (JSE: SPP)
Things seem to be going from bad to worse
Spar closed 7% lower on Friday after giving the market a negative surprise around leadership. Angelo Swartz has resigned as CEO, having been with the group for 19 years. He was only in the top job since October 2023, so that’s not a terribly long innings by CEO standards.
The group isn’t exactly on a firm footing right now, hence why the market punished the share price for this turn of events. It helps a bit that Reeza Isaacs, the current CFO, will be stepping into the CEO role. This at least shows some internal continuity.
Megan Pydigadu, currently the COO, steps into the CFO role. The experience she gained in the turnaround of iOCO (JSE: IOC), which was of course still called EOH at the time of the turnaround, will no doubt be useful at Spar.
A further leadership change is the creation of a Managing Director position for Groceries and Liquor in Southern Africa. I don’t like this at all, as it suggests that top management will be straying further from the core business and will be focusing their attention elsewhere.
Above all, I sincerely hope that Spar isn’t cooking up another offshore acquisition. If you think the market response to Mr Price (JSE: MRP) announcing the NKD deal was bad, just wait until you see what would happen if Spar does something ridiculous. The only thing they should be doing is focusing on their core business – and it should be getting maximum attention from the top execs.
There’s a trading update call scheduled for Monday morning, so investors will no doubt have some pointed questions about this development.
Nibbles:
Director dealings:
The CFO of Calgro M3 (JSE: CGR) bought shares worth R203k.
An associate of a director of Visual International (JSE: VIS) sold shares worth R124k.
Magen Naidoo has bought another R7.6k of shares in Mantengu (JSE: MTU). You’ll find an important update on the leadership of the company further down in the Nibbles.
AfroCentric (JSE: ACT) announced the disposal of Active Health back in December 2025. It’s a Category 1 transaction, so they need to get a circular out. The JSE has granted an extension until 24 April 2026 to distribute the circular.
Northam Platinum (JSE: NPH) announced that the revolving credit facility has been increased from R11.3 billion to R13.3 billion. It matures in August 2027, giving them useful flexibility on the balance sheet. They also have a general banking facility of R1 billion, so the total available banking facility is now R14.3 billion. The plan is to push further into renewable energy projects that are owned and built by the company, rather than relying only on power purchase agreements with independent power producers. By 2030, Northam expects to source 70% of group energy needs from renewable sources.
Boxer (JSE: BOX) announced that James Formby is stepping down as chair with effect from 28 February 2026. The interesting element to this story is that Sean Summers, the CEO of Pick n Pay (JSE: PIK), will be taking the role of non-independent, non-executive chair. Formby will remain on the board, just not as the chair. And in case you’re wondering, Charlotte Maponya will continue as lead independent director of Boxer. If Summer’s appointment confuses you, just remember that Pick n Pay still holds a controlling stake in Boxer.
Mantengu (JSE: MTU) announced that CEO Mike Miller has resigned with effect from 28 February 2026. Those who followed the story last year may be aware that I was on the receiving end of a number of completely unsubstantiated allegations by Miller. I hope he finds peace in whatever he does next. And most of all, for the sake of the employees at Mantengu, I hope that incoming CEO (and current CFO) Magen Naidoo can improve things at the company, as recent performance has been very concerning. The jury is still out on whether any of the share price manipulation allegations have merit, as there were a number of parties accused of being involved. Will we ever really find out? Honestly, who knows – it’s one of the most bizarre stories I have ever seen on the market. And in case you’re wondering, Langton Mpofu has been appointed as the CFO to replace Naidoo. Mpofu has been with Mantengu since 2024, so there’s at least some continuity there.
Goodness knows what the reason for the delay is, but the special dividend declared by Caxton and CTP Publishers and Printers (JSE: CAT) has not received approval from the South African Reserve Bank (SARB). For this reason, the company has chosen to withdraw the declaration of the dividend and rather declare an interim dividend of the same value as the intended special dividend. Interim dividends don’t need approval by the SARB. I would love to have been a fly on the wall for some of the discussions that would’ve taken place in the background here!
Shareholders of 4Sight Holdings (JSE: 4SI) approved the repurchase of shares from Silver Knight Trustees at 55 cents per share. The value of the repurchase is R10 million. That might not sound like much, but the market cap of the company is R390 million. Perhaps more importantly, the current share price is significantly higher at 71 cents.
I generally ignore independent director changes that don’t have other interesting elements to them, but a change in the chairperson of the board is always worth mentioning. Insimbi Industrial Holdings (JSE: ISB) noted that Robert Dickerson will retire as chair, with Nelson Mwale taking that role with effect from 28 February 2026. There are changes to board committees as well.
Trustco (JSE: TTO) has decided to terminate the American Depository Receipt (ADR) programme that trades in the over-the-counter (OTC) market in the US. Holders will have until 26 March 2027 to swap their ADRs for underlying ordinary shares, which would then need to be held on the Namibian or South African register. Is this a precursor to the promised full-fat listing in the US, instead of the skim milk version on the OTC market?
As artificial intelligence begins reshaping the labour market, the real risk may lie in the turbulent gap between jobs lost and jobs created. The uncomfortable question is whether our economic safety nets are built for disruption at this speed and scale.
Somewhere around the start of last year, I began to feel anxious about artificial intelligence. Not in a Terminator-style, the-robots-are-coming kind of way, although Anthropic co-founder Dario Amodei’s prediction that AI models will one day build and control their own robots did make me feel a bit… queasy.
No, my anxiety comes from a much more practical place. I’m anxious because I struggle to understand what happens when we have more people than we have jobs for.
When I read AI-related thoughtpieces online, there is a lot of talk about the smaller workforce of the future, with parallels drawn to those shrinking birthrates that are currently alarming statisticians worldwide. It makes sense in the (very) long run: a smaller global population would equal a smaller human workforce, and the gaps left by people could be filled in by AI.
Seems like a neat solution, right?
But what I don’t quite understand is what happens now, in the year 2026, when our world population stands at 8.3 billion and the global workforce is at 3.7 billion. The clever people at McKinsey are constantly running models to try figure this out, with their latest research suggesting that between 400 million and 800 million individuals could be displaced by AI-ification in the next 4 years.
The awkward middle of automation
Of course, this isn’t the first time in human history that invention has led to job loss. We could look back at the Industrial Revolution, for example, or more recently, at the invention and widespread adoption of the personal computer.
In the US alone, about 3.5 million jobswere lost to the adoption of the computer and the internet in the 1980s and 90s. For context, the US population at the time was around 250 million, and 63% of Americans – around 160 million people – were employed. So, roughly 2.2% of American jobs were lost to new technology in the 90s.
A somewhat stark comparison to the roughly 15% of jobs that McKinsey predicts will be felled by AI, isn’t it?
But on the flipside of that coin, an estimated 19 million US jobs have been created since the 90s as a direct result of computer technology. Here we are just a few decades after the big disruption and about 10% of the civilian labour force is in an occupation that’s a direct result of the introduction of the computer.
History therefore teaches us that the computer and internet did indeed create more jobs. And how many jobs AI will create is certainly one question. But perhaps a more important question is: who will these new jobs be for?
History is far murkier on whether those who are displaced are the ones who get to claim those shiny new jobs. And with what we are currently observing in AI, this feels very different to someone learning to point and click a mouse.
The new roles that AI is expected to generate – things like prompt engineers, data annotators, AI auditors, model trainers, and robotics technicians – tend to sit on the more technical end of the skills spectrum. They reward digital fluency, adaptability, and in many cases, formal training. If you held a position as a delivery driver, a call centre agent, a retail cashier, or a bank teller – all roles that are earmarked for AI replacement – then the distance between your current skill set and the jobs being forecast is not necessarily a short one.
Entry-level white collar roles are at serious risk, as are junior professional roles that require training from senior staff.
Reskilling sounds good in theory, but in practice it can be a slow and expensive process. It also assumes people have the time, stability, and financial buffer to retrain themselves while their income is under pressure – and we are talking about a generation that can barely even afford to have children, let alone build up a balance sheet to withstand a crisis.
Labour markets do not rebalance overnight. Even if AI ultimately creates more jobs than it destroys (an outcome that is predicted, but not guaranteed), there may well be long and uncomfortable gaps in between. In those gaps, we could see mid-career workers struggle to pivot, while younger workers flood into new sectors faster than older ones can adapt.
The transition period, in other words, is where most of the real human pain tends to sit. In considering how to address this pain, we can refer to a writer named Paine. Nominative determinism never lets us down.
The original “disruption dividend”
Once upon a time (in 1795, to be precise) a political thinker named Thomas Paine published a pamphlet titled Agrarian Justice. Paine wrote his pamphlet because he was bothered by the rise of private land ownership. While he accepted that enclosing land was a logical step in the development of agriculture, he worried about what was being lost in the process: rivers, fields and orchards that had once functioned as shared sources of food were now disappearing behind fences and property lines.
In his writing, he shared his belief that those who benefited from private land ownership had some obligation to compensate the wider public, from whom the ability to sustain themselves – to hunt, fish, gather or farm on open land – had effectively been taken.
Paine didn’t stop at theory. He sketched out a concrete funding model where landowners would be taxed once per generation to support those who owned no land at all. Even in the late eighteenth century, the architecture is recognisable: not charity, exactly, but an attempt to design a system-level response to the economic dislocations created by structural change.
I heard echoes of this story when I first read the news that OpenAI’s Sam Altman was funding a basic income experiment in the US. From 2020 to 2023, Altman’s OpenResearch distributed $1,000 a month to 1,000 low-income participants in Illinois and Texas, while a control group of 2,000 people received $50 monthly. All participants were earning at or below 300% of the federal poverty line, with average annual household incomes under $29,000 (or around $2,400 per month).
The findings were intriguing. At the risk of straying from the main thread of this article, I encourage you to explore OpenResearch’s full report here. What fascinates me is the parallel between these two stories, even though they are separated by two centuries.
In 1795, Thomas Paine argued that people should be compensated as they lost the ability to sustain themselves from the land. In 2021, Sam Altman wondered whether people might one day need compensation as they lose the ability to sustain themselves through their labour. Paine didn’t try to block private land ownership, because he understood that, while it was disruptive to the status quo, it was necessary in order for agriculture (and by extension, humanity) to progress.
Similarly, Altman seems to be acknowledging that artificial intelligence will bring inevitable disruption, and that this disruption is necessary in order for our species to advance to the next phase. Like Paine, he appears to be wondering whether those who “own the land” should be responsible for addressing the gap left by their inventions.
Who actually pays for AI disruption?
Each major technological leap expands what the economy can produce, and unsettles how people earn a living along the way. Artificial intelligence appears to be following that same script, only faster. The real tension is not the long-term outcome, but the messy transition period in the middle, where labour markets tend to wobble before they rebalance.
That is why the basic income conversation keeps resurfacing. Not because it is politically easy (it is not), and not because it is proven at scale (it is not that either). An unconditional universal basic income, in its pure form, has never been successfully implemented at national level. What we have instead are pilots, partial schemes (like the ones implemented during the Covid-19 pandemic) and local experiments. And while these are all useful signals, they are far from settled policy.
Of course, even if the basic income model could be made to work inside one country, a more complicated problem sits just beneath the surface. Back in 1795, the world was a whole lot less connected. Thomas Paine was writing about taxing land within national borders to support that nation’s citizens.
Today’s AI economy does not respect those boundaries.
The companies building the most powerful systems are concentrated in the United States, but the labour disruption that those systems will trigger is spreading globally. If the “owners of the land” – the AI creators – are only taxed or regulated in their home markets, the resulting support mechanisms will also remain largely domestic.
That creates an obvious imbalance. The productivity gains may cluster in the US, where the technology is developed, while labour market disruption ripples outward into economies with far less fiscal room to cushion the blow. The geography of AI profits vs. AI pain is not set to line up.
So how does the world deal with that mismatch?
One idea occasionally raised in policy circles is some form of cross-border adjustment in the form of tariffs, usage levies or access fees on advanced AI tools deployed in foreign markets. For example, if you are a South African business preparing to replace a South African employee with technology that makes profit for an American business, the government could make you pay more for that choice through tariffs. In theory, this could help recycle a portion of AI-driven value back into the regions absorbing the labour shock, as companies will weigh up the cost of AI tokens vs. the cost of a warm body in the office.
In practice, it would be technically complex, politically sensitive and highly contested in global trade forums. But solutions seem thin on the ground right now.
The deeper we move into an AI-shaped economy, the clearer it becomes that this is not just a domestic labour story, but a global one. Technological disruption rarely waits for policy to catch up. It compounds first, and the surrounding systems adjust later.
The open question is whether we start designing those adjustments while the shift is still gathering speed, or only after the imbalances have already taken hold. Society as we know it today may depend on the answer to that question.
About the author: Dominique Olivier
Dominique Olivier is the founder of human.writer, where she uses her love of storytelling and ideation to help brands solve problems.
She is a weekly columnist in Ghost Mail and collaborates with The Finance Ghost on Ghost Mail Weekender, a Sunday publication designed to help you be more interesting.She now also writes a regular column for Daily Maverick.
Blu Label Unlimited’s results are still impacted by once-offs (JSE: BLU)
But they have taken a big step towards “clean” numbers
Blu Label’s economic relationship with (now separately listed) Cell C (JSE: CCD) has no doubt inspired many a sadistic FinAcc IV examiner. With a reputation for arguably the most confusing set of financials in the local listed market, the hope is that the separation of Cell C will help create more understandable numbers going forward.
But we aren’t quite there yet. Cell C only listed at the end of 2025, so Blu Label’s numbers for the six months to November 2025 are still full of complexities. There also happens to be an impairment of R6 billion on The Prepaid Company’s investment in Cell C, partially offset by a gain on remeasurement.
Thankfully, the trading statement gives us some numbers that are actually useful. If you strip out everything related to the restructuring of Cell C, you arrive at revenue for Blu Label of R5 billion, EBITDA of R535 million and net profit after tax of R389 million. Core headline earnings of R398 million translates to 44.19 cents per share in earnings.
Notably, Cell C will be equity accounted by the group, as Blu Label has retained a non-controlling 49.47% interest. Equity accounting is much simpler than consolidation accounting, as any tired and weary accounting student will tell you.
But here’s something else to chew on: core HEPS is down by between 10% and 14% year-on-year. Even if you use the simpler numbers, it doesn’t look like the business had a great year.
Those who bought this story in 2023/2024 did extremely well, with high returns in a short period of time. But those who bought the hype in the run-up to the Cell C listing have been smashed. I haven’t participated at all, as I only buy things that I think I understand.
The markets are hard enough without backing yourself to win a game of musical chairs:
City Lodge’s results would be so much better without the forex movements (JSE: CLH)
At least the dividend is up strongly
My City Lodge position is currently up 16%. That’s certainly not bad, although recent weakness in the share price has taken some of the shine off the returns.
Group occupancy rates for the six months to December 2025 tell a positive story, increasing by 420 basis points to 61.6%. This is the highest occupancy rate since pre-Covid. Combined with an average room rate growth of 4%, revenue was up by 12%. It’s also worth highlighting that rooms revenue increased 10%, while food and beverage revenue was up 17%.
Food and beverage revenue is now 20.5% of total revenue, an exceptional example of management’s strategic execution in recent years.
With total costs up 9% (a solid outcome in the context of higher occupancies), adjusted EBITDAR was up by 16%. And no, the R on the end isn’t a typo – EBITDAR is the industry standard in hospitality.
Adjusted EBITDAR margin was 130 basis points higher at 32.5%. In terms of cash returns, their cash generated from operations increased by 39%. That’s another encouraging metric for the underlying performance.
It all sounds great so far, right? Well… there’s a catch.
Sadly, HEPS actually fell by 0.5% thanks to forex movements. The stronger rand gave them an unrealised loss on forex of R24.7 million vs. a gain of R10.9 million in the prior period – a nasty year-on-year swing. This mainly relates to an intercompany rand-denominated loan in Mozambique.
The group reports adjusted HEPS growth of 33% in an effort to convince investors to focus on that number. It helps that the dividend also increased by 33%, as there’s nothing quite like cash returns to help focus the minds of investors.
The HEPS performance was assisted by share repurchases in the past year, as City Lodge has repurchased 6% of shares in issue at an average price of R4.00 per share. The current share price is R4.75.
Despite this promising underlying narrative and a number of refurbishment projects underway to take advantage of improving local conditions, January occupancy levels were irritatingly weak. They fell by 200 basis points to 42%. Total revenue was up 4% year-on-year, but that’s not great. February was even worse, with occupancy down 400 basis points to 56%. At least they’ve managed to achieve better average room rates and food and beverage revenue in February, with total revenue up 5% despite the drop in occupancy.
The second half of February is showing some momentum. They are hoping it continues.
At least I wasn’t hallucinating the slow start to the year. I couldn’t understand how things were taking so long to get going. Based on this update, people clearly took their time to get out of bed in 2026. I still can’t really figure out why.
Equites Property Fund affirms guidance and highlights appealing metrics (JSE: EQU)
Their portfolio has locked in above-inflation returns
Equites Property Fund has released a pre-close update dealing with the year ending February 2026. With a low portfolio vacancy rate of 0.3% and weighted average lease escalations of 6.2% in the portfolio, key metrics look good. Guidance for growth in distribution per share of 5% to 7% is unchanged for FY26.
As Equites quite correctly points out, their weighted average lease escalations are more than double the current SARB inflation target. With a weighted average lease expiry in the portfolio of 14.1 years, they are poised to significantly beat inflation for a long time. And thanks to triple-net leases that put cost exposure on the tenants rather than the landlord, the fund feels good about turning revenue growth into distributable profits.
The loan-to-value is expected to be 34.2% at the end of the period, down from 36.0% at the end of FY25. The balance sheet is therefore in good shape.
The loan-to-value ratio will come down further when more of the UK disposals are concluded. Some properties in the UK are being held while rent reviews are finalised, as this improves the chances of a successful exit. They do still have development plans in Equites Newlands Group Limited (ENGL), the platform in the UK that Equites owns alongside Newlands Property Development LLP.
But the real focus is on South Africa, where logistics space demand has remained strong. The R21 corridor is particularly appealing to Equites, with a joint venture in place with Tridevco to maximise their chances of capturing this demand. Overall, sector vacancies are just 2%.
A good example of a typical project is a development for Tiger Brands (in partnership with Tridevco), with a yield of 9% on a development cost of R1 billion. They are in advanced stages of negotiating further development leases with an expected capital investment value of R1 billion over the next 12 to 18 months.
In case you’re wondering about how this development yield compares to the cost of funding, Equites has a cost of debt of 8.2%. They’ve had some encouraging recent bond issuances and debt refinancings, so that helps to keep their cost of debt on the right side of their development yield.
Although construction cost inflation helps the value of existing properties, it can also make it difficult to achieve an attractive yield on new builds. Equites noted that the Construction Input Price Index (CIPI) showed average inflation for the year of just 1.5%, well below the 5-year and 10-year averages of 8% and 6% respectively. It picked up towards the end of the year though, so that is something that Equites will need to carefully manage.
There is limited exposure to renewals in the next 24 months. Although you might think that is a good thing, it can actually be a drag on earnings if we are in an environment of positive reversions. It looks like the FY27 renewals could achieve a significant positive reversion of 17%, while FY28 is far less appealing with an expected negative reversion of -9%. The logistics funds have lumpy leases vs. retail funds.
And for the renewable energy enthusiasts, you’ll find it interesting that the sector is generating 16% of total energy demand from solar (according to Nedbank CIB Market Research). It helps that distribution centres have huge roofs! This is an obvious area of investment by logistics property funds, particularly with so much pressure on electricity tariffs.
I’m curious to get your views on the property sector. Which asset class do you like the most?
Gold Fields joins the earnings party in the sector (JSE: GFI)
As you know by now, the gold miners have been printing cash
Gold Fields has now added its name to the list of gold mining houses that made a fortune in 2025. For the year ended December 2025, they achieved a jump in attributable profit from approximately $1.25 billion to $3.6 billion. The move in headline earnings was a slightly less thrilling increase from $1.2 billion to $2.6 billion.
On a per-share basis, this means that HEPS more than doubled from 133 US cents to 288 US cents. The base dividend per share for the year was R25.50, up from R10.00 in the prior year. In addition to this, they have declared a special dividend of R4.50 per share.
This kind of dividend growth is made possible by adjusted free cash flow jumping from $0.6 billion to nearly $3 billion.
One of the highlights is that all-in sustaining costs only increased from $1,629/oz to $1,645/oz. In a period where the gold price moved higher, that’s obviously a huge boost to profits.
The jump in earnings helped them reduce net debt from $2.1 billion to $1.4 billion. The entire sector is deleveraging at the moment, with bumper profits being used to repay lenders.
Although there’s obviously more variance in performance once you dig down into the individual mines, the group results are clearly good news for shareholders. The Gold Fields share price is up 134% in the past year – well behind Pan African Resources (JSE: PAN) as my lucky pick that managed to increase by 311%!
Jubilee Metals is on track for 2026 copper production guidance (JSE: JBL)
This is despite the rainfall in Zambia
Mining is a tough game. There are many external risks, with the weather being just one of them. If there’s enough rainfall, then extracting metals from the ground becomes difficult – and sometimes, impossible.
In an update covering the six months to December 2025, the Jubilee Metals narrative is one of strong production despite the expected rainfall.
The Roan Operations hit their targeted production level of a feed rate of 30,000 tonnes per month. Copper production was up 172.8% for the first half of the year vs. the comparable period in the prior year.
The Molefe Mine operations seemed to get the worst of the rain, with damage to road and bridge infrastructure in the surrounding area. Nonetheless, operations were expanded and they delivered product to the Sable Refinery.
With initial resource drilling at Molefe Mine awaiting lab results, Phase 2 of the expanded resource drilling at the asset commenced in February 2026.
Total saleable copper units produced increased by 8.7% vs. the prior year. This excludes stockpiled concentrate at Roan and mined material at Molefe. This tells you that Sable is essentially the bottleneck in the value chain.
Copper production guidance for FY26 is unchanged at 4,500 tonnes to 5,100 tonnes. This is much higher than 2,211 tonnes in the prior year.
Of course, this guidance depends on what happens with further rainfall. It’s hard enough to forecast what might be coming out of the ground. It only gets harder when you also have to consider what might fall out the sky.
Margins move higher at Kumba Iron Ore (JSE: KIO)
But free cash flow went the other way
Kumba Iron Ore has released results for the year ended December 2025. The story isn’t exciting on a top-line level, with revenue up just 2%. This is because production volumes increased by just 1% and export sales volumes were up 2%.
Thanks to the classic mining strategy of controlling their controllables (something we can all learn from), Kumba achieved cost savings of R673 million and improved their adjusted EBITDA margin from 41% to 46%. This drove an impressive 18% increase in HEPS! Major constraints like Transnet’s capacity have forced Kumba to look inwards for every possible efficiency gain.
On a per-unit basis, material cost savings were achieved at Kolomela (cash cost down 7%) rather than Sishen (flat cash cost).
Despite this earnings growth, the total dividend for the year was down 17.2%. This is very similar to the 17.2% drop in attributable free cash flow.
When you see something strange like this, it’s worth digging further.
Your base assumption might be that higher capex is to blame. But if you find the note for attributable free cash flow in the financials, you’ll see that capex (the “Additions to property, plant and equipment”) increased by less than R400 million year-on-year. This is only part of the reason why free cash flow has dropped by R2.5 billion:
This table shows us that we need to go digging into cash generated from operations to actually understand what’s going on here. If the swing isn’t because of capex, then it’s usually because of working capital (debtors / creditors / inventory). Sure enough, that’s where you’ll find the big movements:
As you can see, cash flows from operations (the first yellow highlight) increased year-on-year as you would expect when profits are higher. But in the prior year, there were massive swings in working capital thanks to a decrease in inventory and receivables, i.e. they worked through inventory and collected old debtors. This creates an impossibly high base for comparison for cash generated from operations (which is net of working capital).
In simple terms, 2024 was a catch-up year and thus 2025 had an unfair base for comparison.
The lesson here? It’s too easy to skim read (or ask your favourite AI model) and quickly conclude that capex is the main pressure point. In this example, whilst there is some capex pressure, it’s really a high base effect in working capital that drove this year-on-year move in free cash flow.
This is also relevant for shareholders in Anglo American (JSE: AGL), which owns just under 70% of Kumba Iron Ore. The increase in attributable earnings will certainly be helpful, but Anglo American could’ve done with a higher dividend to go with it.
A billion euros in EBITDA at Mondi – but only just (JSE: MNP)
Margins have contracted and HEPS has fallen
Mondi operates in a challenging sector. Packaging and paper is a highly cyclical industry, with the current point in the cycle being rather ugly. Sector peer Sappi (JSE: SPP) has found this out the hard way, coming into this part of the sector with a balance sheet that was stretched too thin.
Mondi has fared better than Sappi, but that’s not saying much:
For the year ended December 2025, revenue increased by 3% and EBITDA declined by 5% to just over €1 billion. This means that underlying EBITDA margin contracted by 100 basis points to 13.1%.
There’s a lot that happens between EBITDA and HEPS, so a weak performance in EBITDA is unlikely to deliver many smiles by the time you reach the bottom of the income statement. Sure enough, HEPS fell by 21%.
That’s still modest compared to the hideous decline in the dividend. 2024’s dividend of 70 euro cents is firmly in the rear-view mirror, with 2025 only managing a dividend of 28.25 euro cents – a decline of around 60%.
Mondi will need to be careful with the balance sheet, or they might end up joining the Sappi share price at the bottom of the dustbin where things get really gross. Net debt to underlying EBITDA increased from 1.7x to 2.6x.
With an uncertain outlook for 2026 and ongoing pressure in paper prices in the first quarter of 2026 thus far, it looks like Mondi will have to fight hard just to go sideways.
Vukile Property Fund is lining up further capital raises (JSE: VKE)
They are looking to get shareholder approvals in place now
As the JSE is such a highly regulated environment, companies need to think ahead and get certain approvals in place if they hope to move quickly on deals.
Companies in most sectors can’t actually do this, as shareholders will rarely give directors the authority to issue a significant number of new shares without the specifics of what they are being used for. But because Real Estate Investment Trusts (REITs) acquire properties in the ordinary course of business, you’ll find that successful companies in that sector find it quite easy to get shareholder approval to issue shares.
Vukile Property Fund is definitely in the “successful” bucket on the JSE, widely recognised as one of the best REITs we have here. They had no problem raising R2.65 billion in October 2025 in an oversubscribed equity raise, which means that there was more demand for shares than supply. This represented 10% of its total shares in issue, so they used up their full authority to issue shares that shareholders had granted at the last AGM.
Now, this is where it gets interesting. Management expects “yield compression” in Iberia and Europe, which means more demand for transactions. This implies a seller’s market rather than a buyer’s market, which is a risky situation for the REITs as they may overpay for assets. Nonetheless, in order to have the flexibility to move quickly on deals, Vukile wants to be able to raise more capital.
This is why Vukile is calling a meeting to ask shareholders for a general authority to issue up to 9% of current shares in issue, with that authority lasting until the next AGM. 9% of the current market cap is nearly R3.2 billion, so we aren’t talking about small numbers here.
The general meeting to approve this resolution will take place on 20 March. I doubt they will have any problems getting the approval. My best current dating advice for you is to find someone who looks at you the way institutional investors look at Vukile.
Nibbles
Director dealings:
An associate of a director of Afrimat (JSE: AFT) sold shares worth R3.5 million.
The CFO of Mantengu (JSE: MTU) keeps chipping away at share purchases, this time to the value of R8.2k.
You can say what you want about ASP Isotopes(JSE: ISO), but the company certainly knows how to keep things ticking over on SENS. The latest news is that Quantum Leap Energy has formed a strategic advisory board with leaders in the nuclear fuel and advanced materials industry. Full focus at the moment is on making that subsidiary as attractive as possible for an IPO.
The next step in the Trustco (JSE: TTO) – Riskowitz Value Fund (RVF) battle is that the Legal Shield Holdings transaction is being unwound. Trustco believes that RVF has repudiated the deal, which means the 200 million shares issued to RVF are undergoing formal rescission. Think of it as a bar fight with lawyers instead of beer bottles and pool cues.
Introducing Capitec Business executives Karl Kumbier, Amrei Botha and Sicelo Mkhize:
Capitec understands the challenges faced by entrepreneurs. Throughout this season of The Finance Ghost Plugged in with Capitec, we’ve explored how affordable transactional banking and access to finance can help business owners grow.
But how does it all come together? And how did Capitec make such a strong impact on the business banking scene so quickly?
In episode 8, we reflect on the acquisition of Mercantile Bank just before COVID hit – and how Capitec’s innovative approach helped shape the products, systems and client experience that followed.
This is The Finance Ghost in conversation with Karl Kumbier (Executive for Business Bank), Amrei Botha (Executive of Client Experience Delivery) and Sicelo Mkhize (Head of Distribution).
Episode 8 covers:
Why understanding SME challenges is the starting point for better products and solutions – including Capitec’s simple, transparent pricing structure
The systems architecture of Capitec Business and why it was built to stand alongside the rest of our business
How the pandemic shaped Capitec’s blend of digital innovation and personal support in the business centres
The rapid growth from 30 000 to 85 000 clients in just one year – and why individual clients still matter
The Finance Ghost plugged in with Capitec is made possible by the support of Capitec Business. All the entrepreneurs featured on this podcast are clients of Capitec. Capitec is an authorised Financial Services Provider, FSP number 46669.
Listen to the podcast here:
Read the transcript:
The Finance Ghost: Welcome to this episode of TheFinance Ghost plugged in with Capitec, where we are building the future of South African business and we’re doing it with, as you’ve guessed, Capitec.
Hopefully you’ve listened to some of the other episodes in the season where I’ve gotten to speak to some really interesting entrepreneurs who are building all kinds of different businesses. Some great stories.
I think South Africa has been a lot more positive in the past year and it’s lovely to see that there are people out there building. And of course, there are a lot of people out there who dedicate their days to supporting the people who are building. That is what this podcast is all about – this particular episode.
Today, we aren’t chatting to small business owners – very far from it, actually. We’re chatting to three executives from Capitec Business.
On the show today, I’m lucky enough to be able to chat to Karl Kumbier, the Executive for Business Bank; Sicelo Mkhize, the Head of Distribution; and Amrei Botha, the Executive of Client Experience Delivery.
All very nice, all very fancy, and ultimately comes down to the same thing, right? Helping small businesses do their thing. Karl, Amrei, Sicelo – thank you. Welcome to the show. It’s lovely to have the three of you.
Karl Kumbier: Thanks for having us on your podcast. It’s great to be here.
The Finance Ghost: Let’s jump in, I think. Karl, we’re going to hear from you first. There are quite a few questions with you. But Amrei, Sicelo, I’m looking forward to chatting to you as well, and obviously jump in as you want to and as you have stuff to add.
Let’s just contextualise the story here, which is that Capitec came from being, as everyone knows, the simple bank. But by ‘simple’, what that really meant is ‘simplicity’ as opposed to simple. So, actually making things easier and taking incredible market share along the way in consumer banking. I mean, everyone knows that story.
Now you’re doing it in business banking. And I can confirm, having opened one of my small business accounts with Capitec now (not least of all inspired by the podcast that we are all working on together) – it works! It does the job. It does exactly what it says on the tin, which was a good experience.
I think where we should start with you, Karl, is just the ‘why’ behind Capitec Business. It really is just important to understand what you guys are building, the journey so far.
And particularly just from a South African context, where small business is difficult – it’s difficult everywhere in the world; it feels like it’s even harder here. How do you help address what small businesses are dealing with?
Karl Kumbier: Yeah. As you said, Capitec’s done really well over the last 22 years in the retail space and grown really nicely. The next logical move is SMEs. It’s a very badly serviced segment. I think SMEs have been ripped off for years on bank charges, etcetera.
And if you think about it, if we can make a difference to an SME’s life – if we can provide access to finance to that small business – what does that do? That helps them grow!
And as the business grows, it creates jobs. As you create jobs, you stimulate the economy. We genuinely believe that we can make a real difference in this country, and help grow this economy.
The Finance Ghost: As you say, it’s fees on one hand. It’s also stuff like access to finance. And there are so many different things that SMEs have to think about, right? It’s also just getting paid!
And I think what triggered this initially was I actually wrote a piece for the Financial Mail (I think this was now last year), because I went and bought coffee at the local Vida. And of course, as I paid, I heard that very familiar little Capitec jingle – you know, that everyone knows and loves and would have heard at the start of this podcast.
I’ll avoid embarrassing myself by trying to replicate it here, but the point is that I heard that and thought, “Hmmm, that’s interesting” – obviously because I’ve been writing about the markets, I’ve been following the Capitec story, but now I just hear it everywhere.
It’s amazing, actually. It’s like the marketing trick of the century, I’ve got to tell you. Very clever that the POS (Point of Sale) machines basically sing to people every time they pay.
Karl Kumbier: We love that sound.
The Finance Ghost: I’m sure! And it actually helps a market analyst like me understand just how well this thing is growing. Because just look around you, right? As you pay, if you hear that, it’s because Capitec is involved here.
Would you say that’s been key to – and we’ll talk about this in more detail – servicing the different needs of SMEs? Because it’s a whole lot of things, right? It’s the basic banking, it’s also payments, it’s access to finance – that’s what SMEs always cry about, right?
Karl Kumbier: For sure. You have to solve for all of the SMEs problems or issues.
And if you think about it, you’ve got a lot of banks out there. You’ve got old legacy banks that have been around forever. Then you’ve got all these fintechs. And if you think about a fintech, they solve for a particular need, right? So, you might have a POS and they solve for that thing really well.
And we see ourselves as a giant fintech – we want to be able to provide those fintech solutions to our clients. But at the same time, we’re able to offer a transactional banking account to be able to facilitate payments.
We can actually do foreign exchange, we can lend you money to buy a car or commercial property or a residential home loan, whatever. We can provide you with a complete solution. So, yeah, you’re exactly right. We’ve had to solve for all of the SME’s needs.
The Finance Ghost: Yeah, it’s a really big part of it. And before we then get into some more detail on how you’ve actually done this, from the outside looking in, people might wonder how Capitec got this big, this quickly – and from a business banking perspective.
One of the ways they did it, of course, is they acquired Mercantile, which is a very classic strategy of buy rather than build. I think what’s happening here is: buy a foundation and then build on it very quickly, right? It feels like that’s what happened here, so maybe just some context to why Capitec took that route.
And then for the listeners, context as well – for the three of you, were you involved before when it was Mercantile, or did you join after that? I’m just curious to get a little one-minute from each of you on your involvement there.
Karl Kumbier: Okay, so I used to run Mercantile. I was CEO of Mercantile Bank. We were owned by the largest bank in Portugal, then we were put up for sale in about 2017.
But selling a bank is a long process to go through, like a tender process. And from a Capitec point of view, if you decide you’re going to go into business banking, you’ve got to make a decision: do you build yourself (which Capitec’s always done), or do you buy something? And if you buy something, the benefit is you’re getting to market much quicker.
Then when we were told we’re going to be sold, I had to go and prepare a presentation and shop around to find out who’s interested in buying us. There were quite a lot of parties interested, but the first place I went to was Capitec, because Capitec was a real success story. It was a case study. We all looked up to Capitec. We were in awe of how Capitec had grown.
At Mercantile, we were a niche business bank. That’s what we did. And we thought if you could combine Capitec’s brand, with Capitec’s balance sheet, with Capitec’s knowledge of scored lending, and then with Capitec’s technology skills – imagine combining that with our business banking skills at Mercantile.
We always thought, “Geez, you can create something really special!” And then when I went to go see Gerrie and the old FD, André (Gerrie just retired recently as CEO of Capitec), the first response was,”Listen, we don’t like buying things. We prefer to build.”
But I think, during the due diligence, they realised that we had a foreign exchange department, we had a rental finance business, we had a POS business, we had a debit order collections business, and most importantly, we had this business banking division that could service transactional banking for clients. We had online banking, we had all the lending products that the traditional banks have. There’s nothing we didn’t offer.
So Capitec looked at this and said, “Wow. If we had to go and build all of those things, it’s going to take…” If you just think about Discovery Bank – it’s a great offering, but it’s taken nine, maybe 10 years? I don’t know how long, to build the bank and have a really good offering in that space.
If you want to get to market quicker, rather buy. So, Capitec decided to up the offer, no conditions, and bought Mercantile – because they could see the benefits.
And yeah, then you’ve immediately got a business that’s profitable from day one – and we pay for all of our own development costs, etcetera – and you can get to market much quicker. So, that’s the reason Capitec bought Mercantile.
The Finance Ghost: Yeah. Fantastic. Amrei, maybe let’s go to you. What was your involvement before/during/after? Were you there with Karl throughout?
Amrei Botha: So, I had the great privilege of joining Capitec just as the deal went through. It’s not often in one’s career where you get the opportunity to start something from scratch. And after a lifetime in small business banking, it was great to join an organisation and a team that’s so passionate about small businesses and making a difference in the SME sector.
And we had all these competencies and skills and capabilities from Mercantile, but also the knowledge and experience of Capitec in scaling a banking operation. It was really great in those early days. Being part of a startup team, very much operating like a fintech.
We were so small at that stage. Karl, I remember the floor I joined was completely empty! We had like four desks for the few of us that started it. Covid hit shortly after, six weeks after. So we had to navigate Covid and building a bank afresh. So, it was a really, really wonderful season and it’s just accelerated from there.
Karl Kumbier: Yeah, I remember Gerrie said to me, “We need someone to set up this area called Client Experience Delivery so that they understand the client experience and they build all the technology to deliver on that and the client’s needs.”
I said, “You know what? There’s one person. She works for the World Bank currently. She’s passionate about small businesses. She flies around the world to countries all over Africa and the Middle East, etcetera, solving for SME’s problems. Let’s have a meeting with her.”
And we met with Amrei and, when we saw how passionate she was about SMEs, we said, “That’s it, then. Come join us and help us build this business bank.”
The Finance Ghost: Very nice. It’s a great story. Sicelo, over to you. How did you get into the fold here? When you joined, were there also four desks on a massive floor that then emptied after that, or was it before or after that?
Sicelo Mkhize: Yeah. Interestingly, my story is quite similar to Amrei’s story. I also joined a couple of months after the conclusion of the acquisition. I think maybe the one part I just want to highlight on my side that actually attracted me to Capitec was really joining an organisation that was founded by entrepreneurs.
When I looked at the landscape, I said, “Who’s the best bank in South Africa that understands the entrepreneurial journey and that can also contribute in terms of really helping entrepreneurs?” So, that’s how my story started.
And to Amrei’s point, obviously, the first couple of months we were hit with Covid. That’s when I actually saw the true culture of Capitec, really being there for entrepreneurs during Covid and helping entrepreneurs to save jobs and ensure that we continue to grow the economy, even at that point in time.
So, yeah, it’s been an exciting journey on my side. And we’re starting to see that fruit coming through, in terms of the benefits that we’re passing on to our small businesses.
Karl Kumbier: Yeah. And also when we met Sicelo for the first time, as well, it’s not often you get a banker that’s got both credit experience and relationship experience.
We just thought, “With Sicelo’s passion for business banking and knowledge of credit, what a fantastic acquisition.” And yeah, now Sicelo runs our entire distribution network and all the larger clients fall under Sicelo.
The Finance Ghost: Yeah, very nice. My little business is also a pandemic baby. It’s interesting how the team that’s on this podcast essentially, from a Capitec perspective (with the exception of you, Karl, who was running Mercantile before), kind of came together around that time and navigated that whole story. It feels like it was so long ago, right? It’s like another era. That was only six years ago.
Karl Kumbier: It was very interesting. And we sat now as Capitec, the deal went through in 2019. Next thing, Covid hits a year later (not even – the deal went through in November and then Covid was in March the next year).
As you can imagine, it was chaos. And Capitec, we sat together as a group exco, and we said, “You know what? We need to keep servicing our clients’ needs. We need to keep making sure we can provide them the necessary service.”
And we said, “How do we get all of our call centre staff – 2,000 people – to actually work from home?” Never heard of, for a call centre. And suddenly, we spoke to our IT suppliers. They delivered like a couple of thousand laptops.
We had these production lines going in head office in Stellenbosch. We had to load all the software and everything we needed on these laptops. We gave them 3G dongles to be able to get Wi-Fi. We trained everyone quickly how to use the new dongle system, etcetera.
And next thing, within three weeks – can you believe it? From the date we made the decision at exco that we’re going to push everyone to work from home to three weeks later, every single one of our call centre staff had a laptop sitting at home and was servicing our clients’ needs. Almost like there was no interruption whatsoever.
And if you had said to us, say six months before Covid, “Would you ever be able to send people home, all your calls and staff and work from home?” You’d say, “No, no chance!” And yet, we managed to do it. We all pulled together as a team and did it.
The Finance Ghost: Yeah, it’s amazing. I think it also talks to the benefit of being part of a larger organisation like Capitec, to be able to do something like that; make those kind of decisions. You know, flick a switch (obviously, way simplifying it) and this amazing production line happens.
Karl Kumbier: Yeah, we’re part of a large organisation, but the way I look at Capitec is as a large business, run like a small business. We have a very flat structure; we don’t care about titles. We can make decisions quickly.
When there’s something to be done, we sit around the table and, once we agree, we all walk out of that office and everyone’s on the same page and we go and deliver. So, it’s a very agile business, for such a large business.
The Finance Ghost: Yeah. I mean, I can give a real-world example of that. Even just discussing this podcast season with the Capitec marketing team, the decision was made quickly and it was made by a few people, so I’ve seen that myself. I agree with you. That does seem to be the way Capitec runs the business, which is great.
Let’s maybe move into that then, and this Capitec culture… You spoke a little bit about how the acquisition helped to plug some gaps, etcetera, but obviously Capitec brought its own culture to this too, versus what you had before at Mercantile.
So, that approach of actually addressing the gap in the market, building out the Capitec Business now from the foundation you had before. Just meshing that culture, the way Capitec thinks and everything else you’ve achieved.
Karl, this is probably a question for you. Just your thoughts around that, as you reflect on that journey?
Karl Kumbier: So, when the deal went through, it took us a year to integrate as a division because the Reserve Bank gave us one year (or two years, I can’t remember, but we did it in one year) to give our banking license as Mercantile.
But the nice thing is that year gave us the opportunity to go and design the business bank of the future. Now the old Mercantile, it was a very high-touch, low-volume business. We only had a few thousand customers, but we had really great relationships with those clients.
We had to say, “Right, but that model’s not going to work for Capitec. You know, Capitec is all about scale, volume.”
Mastercard actually sponsored a session for us, so we (myself, Gerrie, who was the CEO of Capitec, the Financial Director, a couple of my senior team from Mercantile and our Head of Technology, Wim, at the group) locked ourselves into a room in Stellenbosch, for literally three or four days.
We just cleared the diaries – no cell phones on, nothing – and we started just throwing ideas around.
After three days of brainstorming, we decided that what we want to build is a business bank that’s digitally led – so you can do as much as you can digitally, because we know entrepreneurs haven’t got time to go into branches and this and that – but relationship-based – so we must have really good relationships with our business banking clients.
When that client approaches the bank, the bank knows exactly who that client is and what they do, etcetera. That was the concept. So, everything we had to build was based around that.
The Finance Ghost: Yeah. I’ve got to say, as a small business owner, I think the word ‘branch’ is basically a swear word. I can tell you for sure, if I hear that word, it’s not happening. I’m banking somewhere else.
So, got to build it as a full digital experience. I completely agree with you on that. And some of the Capitec DNA stuff really seems to be coming through as well. I mentioned the word ‘simplicity’ earlier, and that’s always been a word that I think Capitec has really leaned on very strongly from a marketing perspective.
And it makes a world of sense to have done so. There are a few others as well that I think have been baked into what you’re actually building. Before we go to Amrei and start to understand more about the client experience, let’s just finish off with you there, Karl, for now at least. How that Capitec DNA has kind of come through in your offering.
Karl Kumbier: Yeah. One of the things that made Capitec successful is the four fundamentals. So, from the very first year of Capitec’s existence (22, 23 years ago), there were four fundamentals that the founders came up with.
Those were simplicity, then affordability, then accessibility and personalised service. So we just said, “Okay, everything we build in the business bank has to comply with those four fundamentals.”
We want a simple offering: one offering for everyone. Doesn’t matter if you’re the largest business with 10,000 employees or if you’re a hairdresser and you work on your own, you have the same offering. You get offered the same thing – same pricing, same everything.
So that’s the simple piece. Then, the affordability. We said, “We want to be the most affordable in the market by at least 30%.” And we can talk about that later, but we ended up close to 50% more affordable, at least.
And then accessibility. When the client wants to speak to the bank, we must be accessible. When the client wants to open an account or do whatever, that must be easily accessible. So we put that in.
And then the last thing is personalised service. I mean, that’s everything for a small business. If you’ve got an issue, you want to be able to pick up the phone or speak to someone, and they can make a decision. You want to do it there and then. So, we had to make sure we have this really good personalised service.
Those are the four fundamentals and every single thing we build in business banking has that. And then, just to add an overlay across all of that, is our culture at Capitec. It’s a very simple culture. We call it the CEO principles.
We want, firstly, everyone to be a CEO in the business, right? But, the C stands for Client, and the client always comes first. Doesn’t matter what we do, we’re not going to do something unless it improves the client experience or drives down the cost of banking for clients. So, that’s the first thing.
The E is Energy. We want all of our staff to have energy. Clients want to deal with energised staff, they don’t want to deal with someone that’s like half-dead!
And then the O stands for Ownership. How do we make sure that all of our staff run this business like it’s their own business? They must have that founder mentality. They must take the ownership and deliver on whatever is in front of them. So, that culture mixed with the four fundamentals are how we built the business bank.
The Finance Ghost: Yeah. An entrepreneurial culture is a lovely thing and you only really notice it if you’ve worked in a place that has it and then a place that doesn’t have it. I’ve done both, so when it’s there, it’s quite a special thing.
Amrei, I think let’s move on to you. World Bank, nogal! Very interesting. I’m guessing your world is a bit more granular these days because now you’re working on things like how people actually come into the system and how the entire onboarding works, how the whole business works, really?
I’m keen to understand, underneath everything, building a bank – that is incredibly interesting! Take us through that. I’m going to just open the floor to you to walk us through what’s been built, because it’s going to be incredibly interesting.
Amrei Botha: Yes, it has been, and we’re not done yet. I think that’s the most exciting part of it. As I mentioned earlier, it’s not often that one gets the opportunity to start from scratch, but also take the best of two great organisations.
At Capitec, we really obsess about the client experience. I’ve been passionate about small businesses all my life. But at Capitec, it really raised the bar in terms of that. The level of granularity, the level of data we look at, the level of client insight we look at, is surreal, really.
We really truly obsess about the client experience and the journey that the client goes through. All the way from the most junior to senior staff, we really obsess around the process. We often talk about people, process, technology, and that those three need to be absolutely the best they can be.
We also have this mantra of “better never rests”. So even if you think you’ve done your greatest work, someone else looks at it and they find an even better way to do it.
And simplicity is also kind of infinite. You think you’ve done something simple and then you look at it again and there’s an even simpler way to do it. So, we really obsess around the number of steps in our processes that a client or a staff member needs to go through.
We obsess about efficiency. We know time matters to SMEs, and so wherever we can save time for SMEs, that’s really important. We worry about the details, the number of fields that a client needs to complete or a staff member needs to complete, the number of screens they need to go through, the number of clicks involved in a process.
Whenever we design something new, that’s what we look at.
In a similar fashion, when we needed to start building Capitec Business, we looked at the client journey from the front door to the growth journey. What does that client’s journey look like?
The very first thing we started with was the Capitec website as the front-door entry point to what became Capitec Business. And we realised at the time (and this is where, I suppose, the rubber hit the road) that the current Capitec site that we had at that time, the information architecture couldn’t allow for business banking.
And so we actually needed, with the Capitec retail team at that time, to redesign the whole Capitec website. And it was exciting. In true transparency fashion (which is a value of ours here at Capitec), the website is not only where we house all of our product information, we also transparently house all of our product and pricing information there.
So clients have access to all of our pricing right there on the website. And that is the true price we charge. There are no Ts and Cs or hidden fees or anything like that.
The Finance Ghost: So Amrei, I wanted to ask you on that though, before you carry on. So to get this right, you guys had to go to group and be like, “Hi. You’ve just bought us and we’re up here in Joburg, we’re very far away from you. But actually, you’ve got to redo the whole website so that we can have a business.” Is that how that conversation went? That’s quite amazing.
Amrei Botha: It is! And it’s… I can’t even begin to articulate how easily those conversations happen in Capitec. If there’s something that’s right for our clients and for the market and what we’re trying to do in terms of adding value, those decisions get made really quickly.
So I think Karl mentioned earlier, the level of decision making is fast here, absolutely. And I think the other thing, Karl, maybe you want to add there before I go on?
Karl Kumbier: Yeah. I just think one thing about Capitec is that there are no silos, which is quite interesting for an organisation this size, right? One thing that I think has been really successful for Capitec is everyone in the bank is incentivised on Capitec’s growth, not the division.
So in other words, it doesn’t matter if you’re going to almost cannibalise one area or someone’s gotta add… it doesn’t matter as long as everyone can buy into the future and says, “No, but that’s good for the bank. Yeah, we’re going to do it.”
That struck me from day one that we were part of Capitec Group. That we need to change a website. Everyone is so excited about building a business bank, they just said, “Geez, where do we start? Let’s go for it!”
And everyone just goes and starts working towards doing it. So, that’s an amazing culture at Capitec, which you don’t get in many other large organisations.
The Finance Ghost: No, that’s rare. I can honestly say that’s very rare. I’ve only ever really seen the silo mentality in most places that I’ve worked, before I went this route. So that’s pretty impressive.
I would have loved to have been a fly on the wall for that conversation, although it sounds like it was easy, it just is what it is!
Sorry, Amrei. I just found that so interesting. That you had to go and redesign the whole group’s site just to make this work. But back to you, then. You were talking about pricing?
Amrei Botha: Yeah, I know, but definitely not easy. The other thing I think that’s important to also highlight is the level of collaboration across Capitec. It is really, truly like a family.
And if you want to bounce an idea off of someone or you need support from a team or department; someone has a skill and expertise that they can add to make something better, people jump in.
To Karl’s point, there are no silos or territories or “this isn’t my space”. We’re all CEOs and we all collaborate together to make sure it’s a success, for our clients and for Capitec.
And I think throughout the build journey, that’s been one of our biggest kind of success factors. That collaboration and support across the group and the skills that got added to our build journey.
But back to pricing. So, the pricing is transparently available on our website and clients can see it there. But beyond that, the website has now since expanded to become the space where clients can commence the process of opening a bank account with us.
They can use our calculators on the website to see if they qualify for credit and for how much. So the website has really become a great tool for clients. And we, on some months, now get 250,000 visitors on our Capitec Business pages. So, it’s really grown tremendously.
And like I mentioned, the website is our front door. It’s our entry point. It’s where you go to also open a bank account, so that was the second piece we needed to build – an onboarding process for new clients.
We knew that the key to our journey would be growth, and first impressions matter. So we built an onboarding process that is fully remote. And I think a lot of that also got inspired by the realities of Covid.
If you never needed to go to a branch, how would this process flow? And if you had to do all of our compliance requirements and meet those standards, how would you do it, completely remote?
The Finance Ghost: Covid was the most weirdly wrapped-up gift in business history. I’m convinced of it. Like, it was the most awful thing, but it also has created a lot of huge improvements in the way we live our lives. Without a doubt.
Amrei Botha: Absolutely.
The Finance Ghost: And it’s that type of thinking, as you say, “How would you do this remotely?” Once you solve for that, then everything becomes digital, and it just becomes easier.
Amrei Botha: Yeah. And it really helped us put ourselves in the shoes of our clients. As a business owner, it may be a remote process, but what happens if suddenly that SME has clients that come in that they need to serve – how do they resume the process easily?
If there are multiple people to sign into that account opening process for compliance reasons, how do you do that in a slick fashion?
Fast-forward a bit, and we can open both sole proprietary accounts and registered company accounts remotely (so, Close Corporations and (Pty) Ltds) in somewhere from 10 minutes. Depending on if there are multiple signatories, how available they are, it can go up to half an hour.
But at the end of that onboarding process, you’ve got your account number, your account is active, you can start transacting, you can make a deposit into it, you can immediately start making payments. And your app and online banking profile is also set up.
Clients are instantly able to also audit a debit card if they need that (and I’ll speak to that in a bit more detail), but on average, about 17,000 clients now join us using our onboarding process. And it was the first patent of my career as well, which was an interesting experience.
We also have an assisted onboarding process, acknowledging that there are some businesses that have three or more directors. There are trusts, partnerships, clubs, associations, NPOs, NGOs. So we open accounts for all those other types of entities as well.
But in those cases where the documentation is a bit more unique, we have our staff assist clients with those application processes. But, really exciting. And our clients give us really good reviews. It’s a key part that has fueled our growth over the last two years.
Karl Kumbier: Maybe just to chip in here. Ghost, you say you’ve opened up an account with us?
The Finance Ghost: Yes, I have.
Karl Kumbier: So you can go onto our website. If you’re a sole proprietor to a company with up to two directors, you open no paperwork whatsoever. You do everything remotely and you can open that account. On average it takes half an hour, but our quickest was like seven minutes.
So, say it takes you 15, 20 minutes to open the account, then once you’ve opened the account, you download your app and you’ve got your online banking that’s active immediately. Then you get a virtual debit card – you do that on the app.
And now in December, we went live with Apple Pay, so then we send you a push notification for Apple Pay and we link that virtual card to your Apple Pay. Then you can go into wherever you used to bank and you do a real time payment into this new Capitec Business account.
And so within half an hour, from start to finish, you’ve got an account that’s really active, operating, working. And that’s what we wanted to build. Something that’s really slick and easy, for our clients to open an account.
Amrei Botha: Yeah. And then it goes without saying that we also needed to build an online banking platform, so that was a journey in itself. And that continues every day now, still. And critical for us was to make that free of charge.
So, similar to our retail personal banking business, our business clients have free access to the app and online banking. Doesn’t matter if you’ve got R1 billion turnover or if you’re a startup still in the ideation phase, you get access to that platform.
And you’re able to not only make payments, but also take up additional products there. You can access credit on our digital platforms, integrate with accounting software, make payments to SARS.
Clients also have the ability to grant access to people within their business to assist with the operations and payment processing. They can set up authorisation flows as well to make sure that they’re in control.
So, it’s a really, really great platform and clients get access to that instantly – and it’s free of charge. Part of the process was also to build a debit card. And it may sound simple, that piece of plastic that we hold, but that was a year’s worth of work.
We had to get a chip certified and the plastic designed and all the processes around it. And again, clients can instantly get their debit cards, whether it’s a virtual card or a physical card, upon account opening. They can personalise it, set their limits, issue additional cards for people within their business as they need. And very exciting, this coming year we’re going to rebuild our credit card and launch that.
So, card has also been a key part. And recently in December, we launched Apple Pay and the other pays are also soon to come. That’s a really exciting journey for us, in terms of ease of payments for our clients.
We also know that a lot of clients have excess cash or save towards specific goals, so we had to rebuild our savings and investment product set.
And just a kind of key interesting stat on simplification: Mercantile had over 412 product types and we’ve simplified that down to 15 across all the different categories of products that a business bank would offer.
So, we’ve got a savings account that clients can also open on the online banking platform, and an investment account that clients can open themselves. And it really helps clients to save towards goals or set money aside for specific purposes.
I think the other exciting build to talk to is our incredible Capitec payments team. They almost reinvented card devices (or card machines) and built a really market-leading product.
There’s a pro device and a print device – exactly the same. The one can print receipts, the other not. But again, we’re in the shoes of our clients and we design from a client perspective, so clients are also now able to get those card devices via our digital platforms or from any Capitec branch.
A really market-leading product in terms of ease of use. It’s the jingle you referred to earlier that people are starting to hear everywhere…
The Finance Ghost: That POS machine is literally the reason we are having this conversation. If I think back, that coffee I bought at Vida, that led to the Financial Mail article which led to my conversation with Capitec.
It was that coffee and that jingle, which is kind of funny. But yeah, it’s a great marketing tool. Don’t underestimate how good that jingle is.
Amrei Botha: And there’s science behind it!
Karl Kumbier: I’m not sure if you saw on the print version, that little slip digitally goes up and then it prints into a physical piece of paper. So, we had this guy in the POS division franchise – he’s a real techie, and he came up with both these concepts. Can you believe it?
He sat there one day and he said, “We want to be a little bit different. We want people to know when there’s a Capitec machine. You’ve got to hear it, not just see it.”
And people will talk about it. It’s an amazing example of innovation from someone from within our technical team.
Amrei Botha: Yeah, we’ll talk about pricing a bit later, but the device is maybe just one of the examples. You often see, at restaurants, the waiter standing with a device up in the air, searching for signal.
One of the really cool features of the device is that it’s got two SIMs and wifi connection, so that a waiter never needs to stand with a device searching for signal – because we know speed matters when processing payments. So, it’s all those little things that ultimately add up to real market-leading products.
We also really disrupted the thinking and the model around POS or card machines. We changed our model from a rental to straight out buy-the-device model. So, clients have a once-off cost, which is much cheaper than the monthly rental fees. And then we also really reimagined the commission rates.
That’s on the product side, Ghost. I think beyond that, Karl mentioned “digitally led, but relationship based”. We really did a lot of build work (and one would think, “How much build is there associated with humans?”), but we did a lot of build work around our service model and our people.
Again, going back to Covid days, it was a debate how, for businesses, face-to-face matters. How do clients want to be serviced? Is it face to face? What do they want to do remotely? What do they want to do themselves?
But through Covid, we learned that most business owners are on the move. Most financial decision-makers are on the move. Their days aren’t predictable. That kind of created a whole different service model approach within Capitec.
We built what we call the ‘Relationship Suite’ where we centralise a lot of our bankers. They are instantly available to our clients, as and when clients need us.
On our online banking channels, as an example, clients can click on a chat button and they instantly connect to one of these bankers to support them if they need any help on the app or online banking activities.
But our bankers, very importantly, assist clients with onboarding. They also assist clients with getting access to credit. That team has grown tremendously over recent years. The big build behind it was not just the centralisation of the staff, but how we truly empower them so that they can make decisions in the moment of client interaction.
What clients often told us in those early days was that they feel like they’re being sent from pillar to post at other organisations. They feel like they’re just a number; they feel like they need to repeat themselves.
And so, quite critical for us is how we give that banker a single view of clients and, very importantly, that that view is available instantly in the moment of interaction.
On average, our bankers answer client calls within 30 to 40 seconds. And while the call connects, they know exactly who they’re going to speak to based on the phone number that’s coming in.
It pulls up the client profile for them automatically and they can see exactly who they’re talking to. They’ve got a full view of recent interactions and challenges the client may have had, so they’re contextually aware in that moment of interaction.
They can also see down to the level of email queries that a client may have had; challenges with solutions. They’re really, truly empowered in the moment of client interaction so that the clients don’t need to repeat themselves.
We also purposely design handovers out of our processes to make sure that our Relationship Suite is able to support clients meaningfully and quickly.
Then we’ve also got our business centres, and this is where Sicelo comes in. We’ve got 19 business centres around South Africa in the nodes of business that matter most. Our bankers in our business centres, they focus on our larger clients, clients that still need the on-site support and the face-to-face deal structuring. And Sicelo heads that portfolio.
Sicelo Mkhize: Thanks, Amrei. I think maybe I’ll start with the relationship suite, just to add one point around that. I think most people actually think, when they’re calling into the bank, that it’s a call centre, or they’re calling into an environment where it’s a robot that’s answering and providing feedback.
On our side, what we’ve done well is we’ve got a team of trained professional bankers that are sitting in the Relationship Suite. I can take any one of those bankers and put them in front of any of the businesses that we’ve got around the country, and they’ll be able to have a quality conversation and be able to assist the client.
So, I think that’s something that we pride ourselves on, in terms of the team that we’ve got in the relationship suite. It services 90% of the entrepreneurs across the country that bank with us.
And then, coming back to Amrei’s point around the 19 business centres (soon to be 20 business centres), it’s basically a team of expert bankers that have a deep understanding of the local market.
If I use, as an example, a business centre based in George, it’s a team of business bankers who know exactly what’s happening in the environment that can actually provide that expert guidance and advice to entrepreneurs.
They can walk down the factory, really understand the client better and be able to position it and provide a solution. What excites me with the teams that we’ve got around the country, they’re fully empowered – in line with our CEO values that Karl spoke about – to make the decisions on behalf of the client and be their trusted business partners.
It’s a very strategic channel for us, that the teams are there for the client to understand their story and are able to articulate it and provide lending. To give you one very basic example, in terms of our bankers, they all have mandates to be able to approve certain credit transactions without necessarily having to go to credit to get support.
It’s almost like the olden days of having a bank manager who’s always available, who understands your business and can provide a decision on the spot. So, I think it’s a very exciting channel for us.
The Finance Ghost: That’s very cool.
Amrei Botha: And we spoke earlier about the Capitec ‘Why’, but what excites me every day when I come to the office is the ‘Why’ of our people. Most of our bankers, they’re really excited to see businesses grow and they are absolutely passionate about supporting businesses to grow.
An example is, in our relationship suite, they’ve got a bell and a big wall where, every time they approve a credit facility, they go and ring the bell. And they don’t celebrate the deal that we’ve written, they celebrate the dream that we’ve enabled.
They’ll write down on that card, “So-and-so was able to find a vehicle that will now enable deliveries,” or, “We financed an overdraft that allows staff to be paid.” So, they’re very specific around the dreams that they’ve enabled for our clients.
The Finance Ghost: And maybe Amrei, I can actually add to that. Because people sometimes listen to something like this and go, “Oh yeah, well that’s the official corporate line and whatever. What actually happens in the background?”
But there’ve been several episodes now in the season and obviously, I get to speak to the entrepreneur who will be a guest on the show – before the show, after the show (I’ve actually become friends with one or two of them, which is pretty cool) – the reality is there’s actually like a raw feedback session and I can hand-on-heart say, sincerely, the feedback is very positive – and particularly around access to funding. So I can believe that – everything you’ve said there, everything Sicelo said there, I can totally believe it because I’ve heard it, and I’ve heard it across everything from property down to franchise, in particular.
And just understanding that stuff. Because everything else you’ve talked about – the onboarding, the opening account – it’s very important, but it’s kind of like, when it’s done, it’s done.
It’s nice if it’s better, absolutely. And it needs to be fast and it needs to be great and all that stuff. But at the end of the day, like long term, when someone tells their life story, “Why were you successful?” It’s not because they opened their account three minutes faster.
It’s because at crunch time, they got the support they needed for the thing they needed to buy that made all the difference. And I think that is the most important thing, at least the feedback I’ve had. It’s very interesting.
Karl Kumbier: Just to chip in there, I 100% agree with what you said. I think access to finance is everything for a small business, because you can’t grow without working capital. You can’t grow, you can’t buy that stock, you can’t buy that delivery vehicle, without finance – unless someone wealthy gave you money (your parents, whatever) to start your business with.
And what we found was a lot of entrepreneurs are too scared to ask for finance because they’re scared that they’re going to get declined. It’s not a nice feeling, being declined. So what we decided to do is we wanted to make sure, for small businesses, we’ll build scorecards and an overdraft just as the most important lending product – because that’s your working capital to help grow your business, right? So you can pay salaries and wages and you can buy stock and do all of those things.
So we came up with a plan. We built scorecards, we used really good data and we pre-approved clients. Now if you’ve been in our books for a while, we pre-approve you and we actually offer the overdraft to you in your app.
You can then look at the overdraft, the terms and conditions, you can sign all the agreements electronically through a selfie and then we’ll load the facility on the account. And the average time it takes to do all of that is three minutes, from start to finish.
So we present you with the overdraft and you think, “Wow, I actually need it.” Because we actually looked at your transactional banking, so we say, “Okay, this person is going to probably need an overdraft.”
They go, “Wow.” And three minutes later, the thing’s loaded on the account. So yeah, that’s exactly right. And that’s why we’re spending so much time and effort on our lending products.
Amrei Botha: Yeah, that’s probably been one of the most significant builds that we’ve done over the last few years. And to Karl’s point, clients can get any kind of facility from R10,000 up to R2 million using that process. And 83% of applications are taken up through our app.
So, it’s been a really accessible way back to our four fundamentals of giving access to credit to our clients. Behind that sits, similar to our client relationship management system that we built in partnership with Salesforce, we’ve also been on a journey to rebuild our credit workflow system. That gives us a view of our end-to-end credit lifecycle for a client. And again, we want to understand the total group exposure of a client, the client’s credit life cycle, and make sure that we can support them throughout that.
I think one of the other innovations that we’ve built over the last couple of years that’s interesting, talking about access to credit, is a merchant loan solution.
So, the card machine we spoke about earlier was a starting point, but we realised the turnover data (of the value of transactions processed through that card machine) can be an interesting way to grant access to finance to SMEs who perhaps wouldn’t otherwise have gotten access to credit, or who don’t have a credit record.
So, we started using the turnover through the device to give clients a facility. And then also, to make the monthly repayment less daunting, we collect daily on those loans.
Once you get a loan, the next client that swipes, we take a small percentage of that towards a loan repayment. It’s a far less daunting way for a small business to get access to finance for buying stock, as an example.
We’ve reimagined that product subsequently, to change it so that we don’t just look at the POS device turnover, but all turnover through the account. That’s also been a really great success.
In less than 10 minutes, clients can get access to those facilities – and again, up to R2 million in size.
The Finance Ghost: Amrei, thank you so much. That is such a brilliant overview of building a bank. I think people are so used to the products, we all use them every single day. We swipe, we make a payment, we log on to our internet banking.
Not everyone appreciates – or very few people appreciate, nevermind not everyone – what has gone into actually building this thing. So, thank you. Some amazing insights coming through there.
And you can kind of see the DNA of Capitec coming through. It’s all about the clients at the end of the day.
Sicelo, I think let’s move on to you, because of course the client needs to pay you something for all of this, and making sure that the fee is nice and competitive is very important, alongside all these other differentiators. And obviously, this is your role, at the end of the day.
As Head of Distribution, you’re in charge of making sure that more people are coming to Capitec Business. So, not just how the pricing helps you with that, but the broader differentiation. If someone stopped you in the elevator and said, “Why should I bank with Capitec Business?” What would that answer look like?
Sicelo Mkhize: Thanks for that. I think, from my side, the most important feedback that we get from clients is the cost of banking. So, one of the things that we looked at on our side is to say, “How do we change that landscape for entrepreneurs?”
We came up with a solution where our transactional banking pricing for business clients is exactly the same as the transactional banking for individuals. In simple terms, if Ghost (as an individual) banks with Capitec and Ghost (as an entrepreneur) and his business bank with Capitec, you get exactly the same pricing experience.
Which is a game changer in the industry. It’s unheard of, if you look at what we’ve done. But what we then also went and did, is to say, “How do we make it so simple that even a child that’s at crèche can understand our pricing structure?”
The Finance Ghost: I have a child at crèche. I’m going to test you on this. Sicelo, I’m going to test you! [laughing]
Sicelo Mkhize: [laughing] I’ve got a two year old, that would be a very good test!
The Finance Ghost: Okay, no, so you understand. Inbetween Bluey we can run them through some pricing.
Amrei Botha: Mine knows it all by heart.
The Finance Ghost: There we go. There we go. [laughing]
Sicelo Mkhize: [laughing] I always laugh when I see the adverts, with my 2-year-old starting to sing the pricing of Capitec as “1, 2, 3, 6, 10”.
But in simple terms, what we’ve done on the pricing. If you bank with Capitec and you want to pay your employees, it’s R1, Capitec-to-Capitec. If your employees bank with any of the other banks, it’s R2 that you’re paying. For debit orders, it’s R3. For immediate payment (which is immediate), it’s R6 on our side. And for cash withdrawal fees per thousand, it’s R10.
So actually, we’ve created a very simple structure for our entrepreneurs. We’ve also received some very positive feedback from some of our clients, telling us that they’ve been able to save up to 50% based on them having joined Capitec.
It really talks to what we wanted to achieve on our side, by reducing the cost of banking in order for us to enable our clients to be able to pass that benefit to their business and be able to create employment. And I think, for us, that’s the exciting part.
I had one client giving me feedback saying that he can afford to buy a beach house with the cost saving that he’s been able to achieve from Capitec. And that’s the true Capitec style, in terms of affordability, that we’ve created and that goes along all the product lines that we present to our clients.
Our merchant devices are the most affordable in the industry and we’re constantly looking at better ways to improve and create more affordability structures for our clients. We often get questions from entrepreneurs saying, “You’re reducing the price in order to hook us in and to then be able to increase the price later on on your site.”
And if you look at Capitec’s history from a retail point of view, call it over the past 5 to 10 years, you’d actually see that the way we think about it is to say, “How do we reduce it even further than where we are at the moment?” I think for us, it’s an exciting space that we’re in, in terms of passing pricing benefits to our clients.
The Finance Ghost: Sicelo, I can’t wait for you to have your parent feedback meeting one day and they say, “You know, your little one is adorable and smart, but the maths is just not mathing. She or he counts, ‘1, 2, 3, 6, 10’ instead of ‘1, 2, 3, 4, 5’.”
I worry for your child’s future in that regard, but I love the simplification. Very nice.
Sicelo Mkhize: They work on simple exponential math. [laughing]
The Finance Ghost: [laughing] 100%. Yeah, there we go, exactly. Just show them that slide from the investor presentation and it’ll be fine.
Karl, let’s bring it back to you then and, in the interest of time, just talking about how quickly this thing has grown. Amrei’s taken us through what’s been built. Sicelo’s talked about how smart the pricing is and everything else. We’ve talked about the Capitec DNA coming into this thing. All of this has added up into success.
That, I think, is the reality. Like most things Capitec touches, bluntly, it’s turned into a success. What does that look like for you, in terms of the growth flywheel and how that’s come through in the stats?
Karl Kumbier: Yeah, so I think, to Sicelo’s point, we’ll save clients at least 50% in bank charges. And the larger you are, the more you save – only because you’re doing more transactions.
We’re saving some of the large businesses moving to us up to 90%. So it’s a massive saving. Then you say, “Geez, but how is it possible that you can make money?”
Because also, for the POS device, we’ve got the lowest commission rates in the country. And we’re the only bank in the country that’s transparent, 100% transparent, in what we charge.
So you’ve got four turnover bands and you get a certain rate. But if you’re doing more than R1 million a month through your POS device, you’re going to pay 0.6% on debit card, 1.6% on credit, which is extremely low.
But the reason we’ve done this is because, firstly, we feel, “Why should you pay more for business banking than you do for retail banking? That doesn’t make sense. Let’s align the pricing and let’s drive down the cost of pricing so that people will come bank with us.”
So we drove down the cost of banking. We signed these small businesses up. When we sign the business, we’ve got transactional data. When we’ve got the data, we can analyse that data, and we can then lend that little business money so they can grow.
And then obviously, if we lend money, we make more revenue and then we use that revenue to keep driving down the cost of banking, like Sicelo said, or we improve the client experience. And then this flywheel will just start spinning as more and more clients join us.
So since we went live, rebranded and repriced, it’s been an amazing growth journey. We literally… In the old Mercantile days, I think we had about, I don’t know, maybe 5,000 clients in total? We’re currently signing up 17,000 new businesses every month.
And then our POS, our merchants – a year ago, if I look at (and I’m just going on June numbers because we’re obviously a listed company and what we disclose to the public), in June, now, half-year numbers: a year before, we had 30,000 merchants trading. At half-year, we had 85,000.
In one year, we grew from 30,000 to 85,000! So we’re signing up loads of merchants.
And then I think, “Have we achieved our goal of growing our lending?” Our lending book has grown 23%, year-on-year, if you look at it from that half year. So, we’ve got a lending book now of R26 billion to small businesses. So, yes.
Are we stopping there? Are we where we want to be? No. We want to keep tweaking the product, keep doing what we need to do. But we’re definitely making nice progress now.
The Finance Ghost: Look, it’s amazing. Congratulations. Well done. And of course, underneath all these numbers are real people running real businesses, who we heard from in the episodes before this one in the season, and certainly the ones to come.
But is there perhaps a top-of-mind – you know, you go home, you’ve had a long day, as great as this all is, we all have bad days – and you think to yourself, “Well, there was that one client where we made a real difference,” or, “There was that one story where I felt really good about something that happened.”
Do any of you have a client story like that, that’s just kind of stuck with you? To the extent you can share it, obviously, without giving away anyone’s personal information.
Sicelo Mkhize: Yeah, thanks for that, Ghost. I think maybe I can highlight two simple examples on our side. There’s a client called Dry Ice International. When they started banking with us, they had just over 50 employees.
And then from that time, three years ago, when they started banking with us, they’ve grown exponentially. Revenue has increased more than 3x, from a growth point of view. And then in terms of number of employees, they’ve also increased their employees to 178 at the moment.
They’ve also expanded their outlets. Where they had two outlets in Johannesburg, they’ve got seven outlets across the country, and they supply to over 90 retail stores across the country.
You’ll probably see them in the airlines, in terms of their products that get utilised to keep the cold drinks and so forth cool. It’s been a great success story, just talking to the entrepreneur behind the business.
It’s actually amazing when you hear the feedback. Since we provided the first lending to him to where he is now and to where he wants to get to in the next five years, we’ve really grown with him in the way that we want, to actually make a difference in South Africa on our side.
So, that’s the one story that sticks out on my side. I know, Karl, you’ve also spoken to the entrepreneur. I don’t know if there’s anything that you wanted to add.
Karl Kumbier: We love seeing our clients grow. To me, nothing makes work more satisfying than seeing our clients growing their businesses because, as I said, they’re creating jobs and they’re creating wealth for themselves.
But one real success story that stood out for me was Cartrack. Cartrack has been banking with us for many years (the tracking company). But when they were still small, they were banking with us.
We did the debit order collections and we did a good job of that. Then we got the transactional banking and just grew and grew. Next thing, they listed on the stock exchange and from there, they listed on the Nasdaq and then the head office moved to Singapore.
Yeah, so that’s a hugely successful story. And so now, we just love seeing businesses grow.
The Finance Ghost: Zak and the team there have built a helluva thing. It’s an amazing business.
Karl Kumbier: Yeah!
Sicelo Mkhize: And then maybe just the last one on my side is a business out of Pretoria, one of the townships in Pretoria. You might have heard from our previous CEO how passionate we are in terms of wanting to change the landscape in the township as well as the rural market, and especially the informal market.
So in this particular story, it’s a business called Delivery Ka Speed. It actually started delivering products in the township. But if I look at the growth over the last two years, it’s actually moved away from that business model into a more formal corporate structure.
He’s actually supplying and distributing on behalf of blue chip companies that are listed on the Stock Exchange. He’s also distributing, for multinationals that supply products in South Africa, into the township. He really understands that market.
He’s subsequently opened up three other branches across the country, which is a phenomenal story coming out of the township.
The Finance Ghost: Yeah, very cool. I love hearing these stories. I think as we start to bring it to a close, let’s just talk about the future of business banking. Just a few minutes on that, really.
And of course, the future of business banking will depend on the future of SMEs and what these problems are that SMEs need to solve, but also the products that you can bring them.
Sometimes, the customer doesn’t know what he or she wants. That’s one of the most fundamental principles of business. Some of the biggest companies in the world have been built like that.
From your perspective, in the years to come, what are you looking to do? I mean, to the extent you can share it, obviously. What are some of the big-ticket items that you think might be coming?
Karl Kumbier: Yeah, I think with the formal market, we’re just going to keep doing what we’re doing. We’re not into bells and whistles; we’re into getting the basics right and offering a good service to our clients.
So, we’ll keep chipping away at the formal market and hopefully bank most of the startup businesses. When you start a business, you think Capitec, and you join us. Then we take market share away from the traditional banks.
So, I suppose that’s the formal market then, but we see a massive, massive opportunity in what we call the ‘emerging markets’ – the township economy. We spent two years in Tembisa trying to understand the market.
We had a team there and, at the end of the day, if I had to summarise, it’s quite simple. In the township market, that little business, they want an affordable bank account, so we can tick that box. You want to be able to accept payment electronically (because it’s not great to have cash), so we’ve now ticked that box with our affordable POS device. And then they want access to finance to be able to help grow the product. We just launched a new product, that Amrei mentioned, where you can actually collect every day, as opposed to once a month.
We’ve now got those three products in place and we’ve got 850 retail branches around the country. So, you’re launching this transactional account through the branch network.
As an example, we’ve got 13 branches in Tembisa, so we’re very excited about that market. They’re going to put a lot of effort into growing the township economy and providing access to finance to people who haven’t really had it in the past.
The Finance Ghost: That is a huge growth area, so I’ll be quite excited to see that come through, I think. Final comments – Amrei, I’m going to ask you for one piece of advice for the entrepreneurs listening to this or one insight that you want to just leave with them, as a part of this opportunity to speak to South Africa’s entrepreneurs.
Amrei Botha: Yeah, I think at Capitec, obviously we are ready and available to support small businesses if they need help. So, just an open invitation. But I think something that is starting to change our business quite rapidly is artificial intelligence (AI).
We’ve seen that that’s actually a very useful tool for a lot of small businesses. And in some of our recent client engagements we see more and more small business owners and entrepreneurs are starting to turn to AI to support their businesses and give them efficiencies and some relief on some of the admin work that they used to do.
So, maybe just an encouragement for businesses to also explore that. Maybe there’s a future Ghost podcast that can deal with that as a topic.
The Finance Ghost: Yeah, don’t be scared of technology; try and find how it works for you. That’s certainly the Capitec way. Sicelo, anything from you?
Sicelo Mkhize: Yeah, I think lastly from my side the most important thing is obviously the entrepreneur. So on our side, we get to support entrepreneurs. We are available to listen to them.
We’re going to give them an umbrella when they need it, even when they don’t know they need it, just to make sure that they’re always protected to grow their business.
I think that’s the part that excites us: really changing the landscape of South Africa and being able to reduce the unemployment through supporting entrepreneurs.
The Finance Ghost: I love it. And then Karl, final words from you?
Karl Kumbier: Yeah, I think the one little bit of advice I can give to small businesses that we’ve learned at Capitec is we always take a long-term view. So, when you’re looking at your business, don’t do things in the short term, to try and get a short-term gain. Do things for the long term. Always look big picture.
As an example, when we repriced, we gave back R300 million in fees to our clients. You say, “Wow, you’re taking a massive knock!” No. We’re taking a long-term view. Over the next 10 years, we’re going to grow our client base.
The only advice I’d give to small business is: always take a long-term view in everything you do in your business.
The Finance Ghost: Yeah, absolutely. And those fee savings are creating jobs, being reinvested in equipment, being invested in dividends so that people get better returns and they start more businesses. All of that is true.
Karl, Amrei, Sicelo, thank you so much for your time today. It’s been a fabulous conversation. We really got into the details, which I love, and I look forward to doing more of these Capitec podcasts with other entrepreneurs.
And to anyone listening to this podcast, go check out the rest of season. Some really genuinely authentic (I can tell you, because I’ve had the off-air conversations with them) conversations with entrepreneurs who have had really good experiences with Capitec and who want to tell their story of their businesses.
So Karl, Amrei, Sicelo, all the best for 2026 and beyond, and thank you so much for your time.
Araxi has pulled the trigger on a major acquisition in the payments space (JSE: AXX)
This is why they have been trading under cautionary
Araxi consists of two businesses: a payments operation that everyone thinks is a great business, and a software operation that very few people think is a great business. Thankfully, in their decision to execute a R1 billion acquisition, they’ve decided to push further into payments rather than software.
Araxi will acquire 80% of Pay At Holdings and its international affiliate. This is the Pay@ business, founded in 2007 and now enjoying over 9,000 retailer locations and many access points across mobile POS payments and downloaded integrated apps. They operate in South Africa, Namibia, Botswana, Zimbabwe, Eswatini and Lesotho.
To make this deal happen, Araxi will need to tap the banks for debt. They are funding the transaction using R200 million of existing cash resources and R800 million in new debt, so the days of having a net cash balance sheet are over.
What are they getting for this price? Well, Pay@ processed over R60 billion in transaction value in the past 12 months, with a compound annual growth rate (CAGR) in revenue of 22% over the past three years.
Does it make money though? For the six months to August 2025, Pay@ generated revenue of R158.8 million and EBITDA of R72.4 million. Net profit was R49.7 million. So yes, it does make money.
With 80% of the company valued at R1 billion, the implied value for 100% is R1.25 billion (even though it doesn’t quite work that way because of the control premium in the 80% stake). But for simplicity, and with the conservative additional step of annualising the recent interim profit without adding on any further growth, the Price/Earnings multiple is roughly 12.5x.
I have no doubt that some synergies are part of the plan, but the good news is that this company makes a profit and is being acquired at a decent multiple that doesn’t require heroic assumptions about the integration strategy.
This is a Category 1 transaction, so shareholders of Araxi will be asked to vote on the deal. Investors are often nervous of large transactions, but this one seems pretty sensible to me.
Aveng flags slightly positive HEPS (JSE: AEG)
At least they aren’t making a headline loss anymore
Aveng has released a trading statement for the six months to December 2025. HEPS of between A$0.1 cents and A$0.3 cents won’t set anyone’s hair on fire, but it’s a whole lot better than the headline loss per share of A$26.7 cents in the comparable period.
Notably, there’s still a small loss per share without the adjustments made to get to the headline number.
The market will have to wait for the release of results on 24 February to get further information. The share price is down 37% in the past year. The chart has odd recent activity that took the share price from below R5.00 to around R7.40 in the space of a few weeks, all before it fell back down again to the current level of R5.13. If you don’t like volatility, the construction sector certainly isn’t for you.
HEPS almost doubled at DRDGOLD (JSE: DRD)
The gold price did the heavy lifting here, as gold production was down
In the gold sector, it always feels like DRDGOLD has to play life on hard mode. By processing tailings, they find themselves dealing with difficulties ranging from security around the Joburg mine dumps through to actually getting access to decent materials to process. It’s not easy, which is why they are particularly reliant on the gold price going the right way.
This is exactly what has happened of course, so the results for the six months to December 2025 look great. Despite a 9% drop in gold production and a 7% decrease in gold sold, they achieved a 72% increase in operating profit and a 98% jump in HEPS.
The average gold price received was 43% higher. It’s pretty hard to go wrong when the product you sell has gone up so sharply in price.
The company acknowledges that the gold price was the “main actor” in these numbers. It helped DRDGOLD add nearly R430 million to the cash position despite having capex of R1.65 billion. The group is undertaking a major capital programme at the moment, with the gold price increase coming at exactly the right time.
They’ve also enjoyed a jump in the interim dividend from 30 cents to 50 cents per share. For all the challenges in the model, this is the company’s 19th consecutive year of declaring an interim dividend. That’s impressive.
The share price is up nearly 190% in the past year.
Glencore met full-year guidance for key commodities (JSE: GLN)
And of course, copper is where you’ll find most of the focus
Glencore has released results for the year ended December 2025. They met guidance for full-year production volumes for their main commodities, so that’s good news for investors. But perhaps the best news of all is that copper production was up nearly 50% in the second half vs. the first half of the year. That’s the kind of momentum that people want to see.
And “momentum” is also where Glencore wants you to focus, particularly because adjusted EBITDA was actually down 6% for the full year. The exit velocity from 2025 is what the bulls will point to here, with second-half EBITDA being 49% higher than the first half.
Glencore has exposure to a number of underlying commodities, so volatility in the numbers is to be expected. It was the energy and steelmaking coal business that dragged the story down in 2025, with metals pricing helping to offset much of the pain.
With steady net debt and illustrative free cash flow generation of $7 billion based on current commodity prices, Glencore feels confident enough to pay a top-up dividend that takes the total dividend for the year to 17 US cents per share. They will pay it in two instalments.
Separately, Glencore announced that they finalised an agreement with Gécamines for land access at Kamoto Copper Company (KCC). In simple terms, this means that KCC can expand the tailing storage facility and related operations, while maximising the recovery of ore reserves within the existing permitted areas. In Big Mining at the moment, it’s all about increasing production of copper wherever they can. Notably, Gécamines maintains the rights to any ore reserves extracted from the leased land.
The share price is up 42.5% in the past year as the market has focused exactly where Glencore wants them to focus: on copper.
Grindrod’s core business is working (JSE: GND)
The market has shown its appreciation
Grindrod closed over 6% higher on Wednesday in response to the release of a trading statement. This takes the 12-month share price performance to 43%, which tells you that they have given the market a lot to feel good about.
For the year ended December 2025, HEPS from continuing operations increased by between 15% and 20%. This puts it at between 172.8 cents and 180.3 cents. For context, the share price closed at R18.74, so the Price/Earnings (P/E) multiple is in the double digits.
The core operations have been boosted by the Port and Terminals business, with the Matola Terminal and the Maputo Port operated terminal achieving record volumes.
Due to the extent of corporate activity in the past couple of years, Earnings Per Share (EPS) will differ significantly from HEPS. The growth rate in total HEPS (vs. HEPS from continuing operations) is also enormous. The number to focus on, though, is HEPS from continuing operations, with the high teens growth rate as an impressive confirmation that the strategy is working.
Merafe’s Lion Smelter roars back into life (JSE: MRF)
Eskom has given them a lifeline – for now
With the ferrochrome industry in dire straits (as confirmed by adjacent casualty Afrimat (JSE: AFT) in their recent update), the likes of Merafe desperately needed a break. Electricity costs have made it impossible to run the smelters.
Keep in mind that Merafe’s business is a joint venture with Glencore (JSE: GLN), so this is relevant to shareholders in that company too.
Now, there are a lot of very good arguments to be made around whether an industry should ever be given a preferential tariff. After all, what makes one special vs. the other? And why should taxpayers subsidise it?
I suspect that the country is better off if an industry like this receives cheaper electricity and continues to employ many people. It’s hard to imagine that the contribution isn’t a net positive.
This debate will no doubt rage on. But in the meantime, Merafe’s Lion Smelter can at least get back to work, with the successful recommissioning of 50% of its operating capacity and a plan to return to 100% by 31 March 2026. This comes after NERSA approved a 12-month interim electricity tariff of 87.74 cents per kWh.
But here’s the catch: Merafe says that the long-term commercially viable tariff needs to be 62 cents per kWh. That’s a long way down from the freshly approved level. It’s also the level at which the Boshoek and Wonderkop smelters can be brought back online, so this shows you how wildly unprofitable these operations would be at a market-related tariff.
The negotiations around the tariff continue. If a viable solution for Boshoek and Wonderkop isn’t found by 28 February 2026, the s189 retrenchment consultation process will begin at those operations.
Pan African Resources and a casual six-fold increase in HEPS (JSE: PAN)
They expect to shortly be in a net cash position shortly
Pan African Resources has been a wonderful story, especially for me as a shareholder. The combination of higher production, strong gold prices and a rolling off of gold price hedges has done wonders for the recent performance.
For the six months to December 2025, revenue was up by 157.3% and HEPS jumped by an astonishing 511.7% (more than a six-fold increase) 1.20 US cents to 7.34 US cents. The record profits have of course led to an even stronger balance sheet, with net debt down 69.3% as at December. By the end of February 2026, they expect to be in a net cash position rather than a net debt position – and this is despite paying large dividends.
The old saying, “it’s a gold mine” is making a lot more sense in this environment.
It isn’t all good news, of course. Although production looks good overall, there were some drags on that story. For example, the Mogale Tailings Retreatment (MTR) facility was around 10% below expected production, with mined grades and recoveries leading to that outcome.
The other obvious negative is that all-in sustaining cost (AISC) was miles above guidance ($1,874/oz vs. guidance of $1,525/oz – $1,575/oz). The stronger rand impacted this by $115/oz, while other negative impacts came from higher share-based payments due to the rally in the company’s share price, as well as third-party material costs at Evander Mines and MTR and the higher royalty payments based on the gold price.
So, some of the cost pressure is actually just a function of success. But some of it isn’t, so shareholders will want to just keep an eye on that. The revised guidance for the full year is $1,820/oz to $1,870/oz.
In terms of total production, they expect between 275,000 and 292,000 ounces of the yellow stuff to come out of the ground. I went back and checked: in the year ended June 2025, production was 196,527 ounces. You can therefore see why earnings are so much higher.
Sibanye-Stillwater’s HEPS increased by 3.6x in 2025 (JSE: SSW)
When cyclicals deliver, they really deliver
It really wasn’t that long ago that the narrative at Sibanye-Stillwater was focused on battening down the hatches and preparing for a long, cold winter in PGMs. Fast forward to today and the company is celebrating a trading statement that reflects a 3.6x increase in HEPS to between 232 cents and 256 cents for the year ended December 2025!
There are two important lessons here. The first is that hope is not a strategy. Companies must always follow a self-help strategy of giving themselves the best chance of surviving long enough to get lucky. The second is that if you can survive, your chance of getting lucky is probably better than you think it is. A mix of realism and optimism is a cocktail that most entrepreneurs will be highly familiar with.
With the average gold and PGM prices (up 39% and 28% respectively) delivering a much better operating environment, lucky is exactly how Sibanye-Stillwater must feel right now. But they also made plenty of tough (and necessary) decisions along the way to get to this point.
Local PGM production was within guidance, as was local gold production. US PGM production was ahead of the upper end of guidance. Overall, there’s an increase in group revenue of at least 160%, so that does great things for profits.
Interestingly, they are still loss-making from an EPS perspective. This is due to non-cash impairments of a whopping R14 billion. One of the main adjustments between EPS and HEPS is to reverse the impact of impairments, giving investors a better indication of cash earnings.
This doesn’t mean that impairments should be ignored entirely, though. They reflect bad outcomes from previous capital allocation decisions. Just one such example is the R7.8 billion impairment of the Keliber lithium project. There has also been some unfortunate luck, like the Kloof impairment due to the reduced life of mine based on geotechnical factors, and the R4.2 billion impairment of the US PGM operations that was triggered by the One Big Beautiful Bill Act.
Those who bought at the bottom of the cycle have had some Big Beautiful Returns, that much I can tell you. The share price is at around R64, miles higher than the 52-week low of R13.88!
Transpaco’s numbers have gone the wrong way (JSE: TPC)
And operating leverage has worked against them here
Transpaco has released results for the six months to December 2025. Revenue fell by 1.5%, with the company blaming the current economic conditions. If we look a bit deeper, the Plastics business increased by 1.1%, while Paper and Board was down by 4.6%.
When revenue dips in a manufacturing company, there’s little chance of profits moving higher. This is because of the prevalence of fixed costs in an industrial model. Sure enough, operating profit fell by 6.1% and operating margin contracted from 8.2% to 7.8%.
HEPS has dropped by 6% to 253.6 cents. The dividend is 6.7% lower at 70 cents per share.
The bigger concern is that the interim period is typically when Transpaco enjoys the seasonal strength of the festive shopping season and the impact on demand for various packaging materials. With a disappointing set of numbers for the first six months of the financial year, the second half is under real pressure.
The share price isn’t the most liquid thing in the world, but it is up 6.9% in the past year. These results don’t support that move.
Nibbles
Director dealings:
A non-executive director of British American Tobacco (JSE: BTI) bought shares worth around R475k.
The financial director of KAL Group (JSE: KAL) bought shares worth R189k. A director of a subsidiary also bought shares, in that case to the value of R69k. KAL is seen as a solid local company, so further purchases by insiders will only add to that sentiment.
An associate of a director of Visual International (JSE: VIS) sold shares worth R76k.
The CFO of Mantengu (JSE: MTU) has added another R12.6k to his recent purchases.
British American Tobacco (JSE: BTI) is presenting at the 2026 Consumer Analyst Group of New York Conference. You’ll find the slides here if you want to check them out. The company also reaffirmed the guidance that was announced on 12 February 2026, just in case people were perhaps worried that something had changed in the past week. This means 3% – 5% revenue growth, 4% – 6% adjusted profit from operations growth and 5% – 8% adjusted diluted EPS growth for FY26.
Efora Energy (JSE: EEL) has renewed its cautionary announcement regarding negotiations for a potential transaction. No further details are available at this stage.
Can Afrimat stop the slide in the share price? (JSE: AFT)
They took a big risk on Lafarge – and the environment hasn’t been kind to them
Businesses go through good times and bad. This is simply a reality of the world that we operate in. This is why investing in shares is a risk, as growth is by no means guaranteed and things can go wrong. The reward for that risk is that you could earn high returns.
Some investors prefer to operate with highly concentrated portfolios that chase the highest possible returns (for the most risk), while others (like me) prefer to spread the risk across many names.
The Afrimat share price chart is a perfect example of why I believe strongly in diversification:
This is a good time to point out that Afrimat is actually a very good company with a strong management team. But if you keep rolling the dice on acquisitions, sooner or later you’re going to roll a 1 instead of a 6.
The share price has lost more than a third of its value in the past year because the timing of the high-risk Lafarge acquisition happened to coincide with several other things going wrong. Perfect storms can happen to the best of us.
Naturally, this means that the market is looking for the bottom in this share price chart. Much like Donkey in Shrek 2, we continuously find ourselves asking: “Are we there yet?”
The answer isn’t easy to figure out.
In a pre-close business update, Afrimat has given plenty of narrative and only a handful of detailed numbers to work with. At least we know that the debt/equity ratio is consistent with previously reported levels, so the balance sheet isn’t getting worse – and also isn’t getting any better. This should improve going forward thanks to asset disposals and the related proceeds being used to reduce debt. They are also in the process of refinancing debt to have a longer-term profile.
Digging into the underlying businesses, we begin with the Construction Materials segment and specifically the aggregates business, where Afrimat expects margin in FY26 to improve slightly, provided you take out the non-core businesses that have been disposed of. They’ve been focused on delivering numerous improvement projects aimed at enhancing margin in the continuing operations. Time will tell what that really means for the numbers.
In the cement business, sales volumes are expected to be up vs. the prior period. The business is sadly still in a loss-making position, but the losses did at least reduce in the second half of the year.
Moving on to the Bulk Commodities business, the significant underlying risk for the iron ore operations is the exposure to ArcelorMittal (JSE: ACL), a business in crisis. Government has been in negotiations with ArcelorMittal for ages now, but there’s still no resolution to the situation that will impact thousands of jobs. At least offtake to the Flats business in Vanderbijlpark increased, but even that part of the ArcelorMittal group isn’t safe in the current environment of massive disruption to the South African industrial base.
The natural response to a lack of domestic demand would be to export the surplus iron ore and tap into the export market. But this isn’t so easy, as volumes are only expected to be flat year-on-year thanks to shipment capacity being 16% lower than the committed rail allocation. The infrastructure in South Africa just keeps letting our companies down. To add insult to injury, international iron ore pricing has dipped from $105 to $101 – and that’s even worse in rand.
In anthracite, the domestic business is suffering with a decline in volumes thanks to the shutdown of the ferrochrome smelters. The Nkomati Anthracite Mine was closed from November 2025 to January 2026 based on the disastrous state of the ferrochrome industry in South Africa. Afrimat had skeleton staff in place this month in anticipation of a restart date for the smelters, but such a date has not been confirmed.
This is one of the places where Afrimat does give specific numbers: local volumes of anthracite are expected to be half of the levels achieved in 2025. Yikes!
In this case, there was a significant boost in exports to try and offset the dramatic decrease in local volumes. They put in a valiant effort, but total volumes for FY26 will still be around 3% less than FY25.
The Glenover project is still important to the long-term plans, but Afrimat has more than enough other things to keep them busy right now. They are assessing different processing methods for this asset and engaging with potential international partners. I can’t imagine that this is getting much headspace from management at the moment. Ditto for Industrial Minerals, which was also impacted by the smelters.
At this stage, it feels like Afrimat is truly between a rock and a hard place – and in a way that even the execs of a quarrying business wouldn’t enjoy. 20 years into their corporate journey, they are dealing with major challenges. I worry about the extent of exposure to major underlying risks like the ferrochrome smelters, and ArcelorMittal, not to mention Transnet in terms of exports. To top it all off, the stronger rand is making exports less attractive for Afrimat and imported alternatives more affordable for its customers.
To answer Donkey’s question: no, I don’t think we are there yet. But what do you think?
BHP is off to a great start in FY26 (JSE: BHG)
There’s a sharp increase in HEPS for the first half of the year
Mining giant BHP has released earnings for the six months to December 2025. With underlying EBITDA margin up by 7 percentage points to 58%, it was a strong period for them. Net operating cash flow increased by 13% and HEPS was up by 30%!
It won’t surprise you that copper features strongly in the story, with an EBITDA margin of 66% and production up 2%. Iron ore isn’t exactly far behind, with an EBITDA margin of 62% (thanks to extensive focus on efficiencies at Western Australia Iron Ore) and production growth also sitting at 2%.
Steelmaking coal is far less lucrative, with an EBITDA margin of only 15%. Production was up 2% in that commodity as well.
BHP certainly knows how to play the game from an investor relations perspective, with the presentation including striking references like “world’s highest margin major iron ore business” and “world’s largest copper producer and resource” – it’s nice to sit at the top of the pile!
And the top is where BHP will remain, now that we know that Glencore (JSE: GLN) and Rio Tinto abandoned talks to create the world’s largest mining company.
With copper production guidance for FY26 increased, BHP is on track for a great year. This is why the share price is up 21% over 12 months.
In a separate announcement, BHP confirmed that they have entered into a streaming agreement with Wheaton Precious Metals International. This has nothing to do with Netflix and everything to do with obtaining upfront funding of $4.3 billion for the delivery of silver from the Antamina mine.
Interestingly, BHP is only a 33.75% shareholder in CMA, the company that owns the Antamina mine. CMA is not a party to this streaming agreement. There’s clearly some fancy financial and legal footwork here, as the streaming deal also doesn’t come through as debt on BHP’s balance sheet, even though it strikes me as an obligation to deliver silver.
The core of the deal is that BHP will deliver 33.75% of the silver produced by Antamina to Wheaton until they have delivered 100 million ounces. After that milestone is reached, BHP will deliver 22.5% of Antamina’s silver to Wheaton. In addition to the upfront payment, Wheaton will pay BHP 20% of the spot silver price at the time of delivery.
MTN is moving ahead with the deal for IHS (JSE: MTN)
But they only want the African towers, not the LatAm footprint
MTN recently confirmed that it was in discussions regarding the potential acquisition of the 75.3% in IHS that it doesn’t already own. IHS has over 28,700 towers across five key markets in Africa, including in South Africa. They serve 10 out of the 13 mobile network operators in Africa.
This deal is an unusual approach to capital allocation, as the industry has been focused on separating the tower infrastructure from the telco operators. With this transaction, MTN is effectively undoing that.
IHS has already announced the disposal of its Latin American (LatAm) business, with MTN very happy to see that go. MTN is only interested in the African tower portfolio, giving it control over much of its infrastructure footprint in Africa. IHS derives around 70% of its revenue from MTN.
This is a chunky deal, with cash of $2.2 billion changing hands. Cleverly, they are using $1.1 billion of cash on IHS’ balance sheet and $1.1 billion from MTN, funded by available liquidity and debt. MTN doesn’t need to do an equity raise for this deal.
The offer price to IHS shareholders is a premium of 9.7% to the 30-day volume-weighted average price (VWAP) of IHS. Once you adjust for the disposal of the LatAm assets, the African tower portfolio has an enterprise value of around $4.8 billion.
Will that be a high enough price to convince shareholders to say yes? Thanks to engagement with other shareholders, MTN has support for the transaction from holders of 40% of the voting shares. They need to achieve two-thirds approval, so there’s still a way to go.
At least they don’t need approval from MTN shareholders as well, as this is only a Category 2 transaction.
IHS generated interim profit of around $106 million for the six months to June 2025. The LatAm assets would be in those numbers I’m sure, so that’s not a pure indication of the earnings that MTN is acquiring. Still, annualising this number shows that they are paying a modest Price/Earnings multiple. This is exactly why MTN’s management sees this as an accretive deal.
Naturally, IHS will still continue to serve all customers, including MTN’s competitors. This is key to the economics of the towers themselves. And even if there was an economic way to squeeze competitors out, I’m quite sure that regulators would be sitting on MTN’s head immediately.
Sirius Real Estate had no trouble raising nearly R1.7 billion in just a few hours (JSE: SRE)
This is the power of the market for successful property funds
You’ll often hear people complain about the pain of being a listed company and how the juice just isn’t worth the squeeze. The property sector is an exception, with Real Estate Investment Trusts (REITs) capable of raising hundreds of millions (and sometimes a few billion) in the space of a morning.
Sirius Real Estate is just the latest example, with the company kicking things off on Tuesday by announcing a raise of approximately £77 million. This was structured as a non-pre-emptive placing of £75 million and a retail raise of £2 million.
They had no struggles in securing this capital, with an announcement just a few hours later confirming that they raised £77 million at a premium of 1% to the closing share price on 16 February 2026.
This means they raised nearly R1.7 billion without even offering a discount to investors. If you can believe it, they managed this at a premium of 1.4% to the 30-day volume-weighted average price (VWAP). Impressive!
To be fair, the company confirmed that they spoke to certain shareholders before the time, so they had lined up their institutional supporters. They will also allow new institutional shareholders onto the register as part of this raise. Another important point to raise is that certain directors and executives will participate in this raise to the extent of £100k. That’s small in the context of the total raise, but still a large number for individuals to be adding to the pot.
The management of the capital raise certainly contributed to the success, but the real story is the underlying strategy and the track record in deployment of capital. Sirius Real Estate is focused on the property market in the UK and Germany, with a particular tilt at the moment towards the defence theme that is playing out in Europe. This means industrial assets in strategically important locations that can attract defence tenants.
This raise will be used for two acquisition opportunities in Germany. The company is in exclusive negotiations and they expect to notarise the properties in the second quarter of 2026, subject to being happy with the due diligence. One of the properties is a long-term sale and leaseback in southwest Germany, while the other is a multi-tenanted site in northern Germany.
The total value for the two acquisitions is £113 million. In case you’re wondering about the gap between the £77 million equity raise and the value of the deals, remember that property funds make extensive use of debt to help achieve the right return on equity. Sirius Real Estate targets a loan-to-value ratio of 40% for the group, although they can obviously tweak that on a deal-by-deal basis if needed.
To give you a sense of pricing, the properties have a net initial yield of 7.6%. As always, Sirius Real Estate sees the potential for value-add strategies aimed at improving the returns over time. The company talks about a “window of opportunity” to do deals at this point in the cycle, which speaks directly to capital discipline.
Keen to learn more about the strategy, especially elements like the defence sector in Germany? Listen to this podcast from December 2025 with the CEO, CFO and CIO of Sirius Real Estate (and you can access the transcript here):
Nibbles:
Director dealings:
As mentioned above in the Sirius Real Estate (JSE: SRE) update, directors subscribed for around £100k (almost R2.2 million) in new shares. The CEO was good for half this amount, with the rest spread across a few executives.
PBT Holdings (JSE: PBT) announced that Spalding Investments, the B-BBEE investment vehicle that holds just over 26% in the company, sold some shares to directors of PBT Holdings and subsidiaries. Various directors bought shares worth almost R1.5 million in aggregate at R6.50 per share. This is small in the greater scheme of things, with Spalding’s stake reducing from 26.61% to 26.39%.
ASP Isotopes (JSE: ISO) announced that the headquarters of Quantum Leap Energy will be established in Austin, Texas. The choice of Texas makes sense based on the recent corporate trends in the US and the customer base that Quantum Leap Energy is looking to reach. In rather colourful language, the CEO of Quantum Leap Energy refers to Texas as the “epicentre of the American nuclear renaissance” – nice! Jokes aside, with all the power demand of data centres and the seemingly endless investment in that space, this feels like the right time to really get the hammer down on accessing the US market.
Tsogo Sun (JSE: TSG) confirmed that over the period since the authority was granted at the AGM in August 2025, they have repurchased 3.12% of shares that were in issue at that date. This has been done at an average price of R6.95 per share, which is slightly lower than the current price of R7.10.
Sibanye-Stillwater (JSE: SSW) released a Mineral Sources and Mineral Reserves declaration. A lot of work goes into these estimates each year. Aside from the obvious reduction from ongoing mining activities, there are other changes to the reserves based on geotechnical considerations. The one that sticks out is Kloof, where the economic viability of the operation was impacted by the removal of isolated blocks of ground. The majority of the Mineral Reserves were written down at that operation. On the plus side, the completion of feasibility studies at various mines helps to increase the reported mineral reserve.
Oando (JSE: OAO) is not a name that comes up very often, yet the company has announced that it plans to issue a whopping 4.4 billion shares in a rights issue. They’ve indicated a price of 50 naira each, which is roughly R0.60 per share. The current share price is only R0.18. I’m not sure where they are going to find over R2.6 billion in support for their rights offer, but I look forward to seeing the circular for this raise. The current market cap is R2.2 billion.
Barloworld (JSE: BAW) had a busy day. One of the final steps in the take-private dance for this group is the redemption of the listed preference shares. The first announcement on the day was that the redemption will be delayed, as approval hasn’t been received yet from the South African Reserve Bank (SARB). They clearly tempted fate here, as the approval came through later in the morning and Barloworld then released a finalisation announcement. The preference shares will be delisted on 3rd March.
Caxton and CTP Publishers and Printers (JSE: CAT) is another company that is waiting for approval from the SARB, although they need the approval to pay special dividends rather than to redeem shares. Caxton has had to push out this special dividend to an unknown date, as they are not sure when the approval will come through. You really have to wonder why we find ourselves in a situation where companies cannot do something as basic as pay a special dividend without waiting for approval from a regulatory body that seems to regularly miss the deadline.
We use cookies on our website to give you the most relevant experience by remembering your preferences and repeat visits. By clicking “Accept All”, you consent to the use of ALL the cookies. However, you may visit "Cookie Settings" to provide a controlled consent.
This website uses cookies to improve your experience while you navigate through the website. Out of these, the cookies that are categorized as necessary are stored on your browser as they are essential for the working of basic functionalities of the website. We also use third-party cookies that help us analyze and understand how you use this website. These cookies will be stored in your browser only with your consent. You also have the option to opt-out of these cookies. But opting out of some of these cookies may affect your browsing experience.
Necessary cookies are absolutely essential for the website to function properly. These cookies ensure basic functionalities and security features of the website, anonymously.
Cookie
Duration
Description
cookielawinfo-checkbox-analytics
11 months
This cookie is set by GDPR Cookie Consent plugin. The cookie is used to store the user consent for the cookies in the category "Analytics".
cookielawinfo-checkbox-functional
11 months
The cookie is set by GDPR cookie consent to record the user consent for the cookies in the category "Functional".
cookielawinfo-checkbox-necessary
11 months
This cookie is set by GDPR Cookie Consent plugin. The cookies is used to store the user consent for the cookies in the category "Necessary".
cookielawinfo-checkbox-others
11 months
This cookie is set by GDPR Cookie Consent plugin. The cookie is used to store the user consent for the cookies in the category "Other.
cookielawinfo-checkbox-performance
11 months
This cookie is set by GDPR Cookie Consent plugin. The cookie is used to store the user consent for the cookies in the category "Performance".
viewed_cookie_policy
11 months
The cookie is set by the GDPR Cookie Consent plugin and is used to store whether or not user has consented to the use of cookies. It does not store any personal data.
Functional cookies help to perform certain functionalities like sharing the content of the website on social media platforms, collect feedbacks, and other third-party features.
Performance cookies are used to understand and analyze the key performance indexes of the website which helps in delivering a better user experience for the visitors.
Analytical cookies are used to understand how visitors interact with the website. These cookies help provide information on metrics the number of visitors, bounce rate, traffic source, etc.
Advertisement cookies are used to provide visitors with relevant ads and marketing campaigns. These cookies track visitors across websites and collect information to provide customized ads.
")
")
")
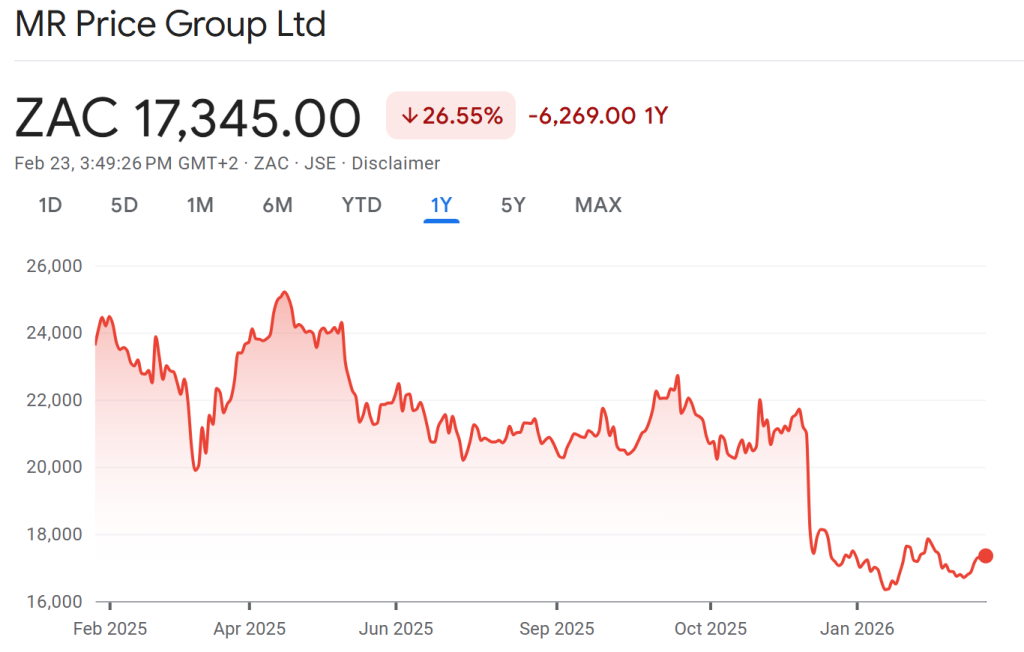
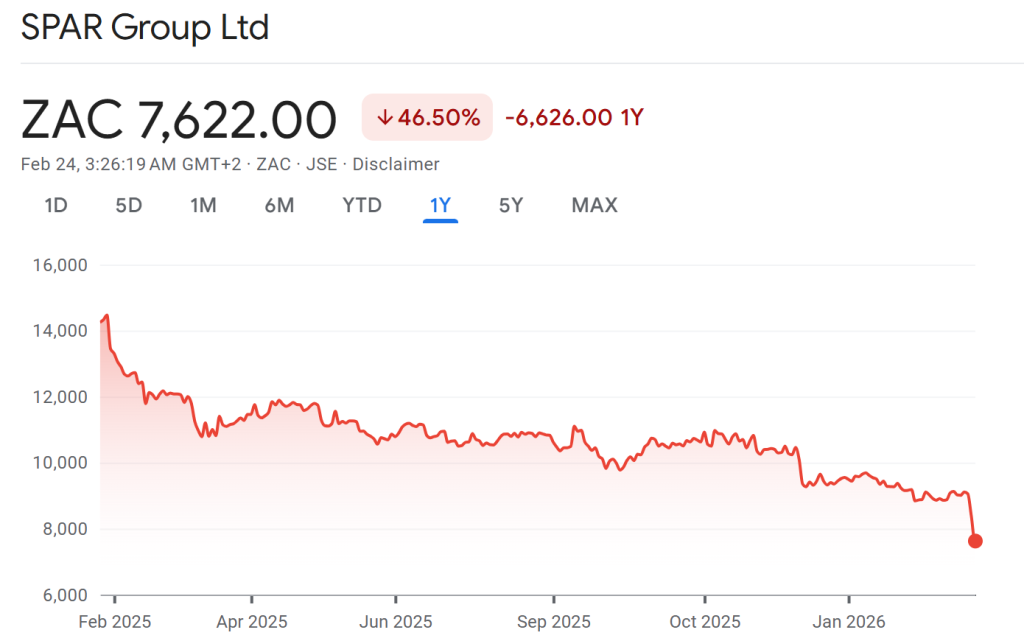


")
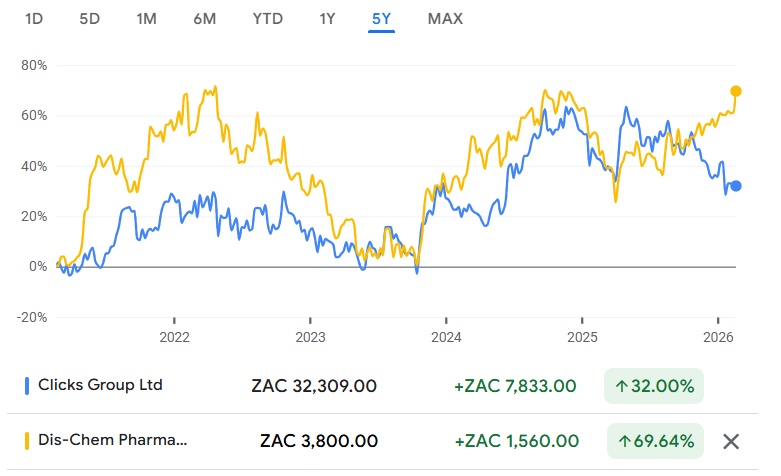


")
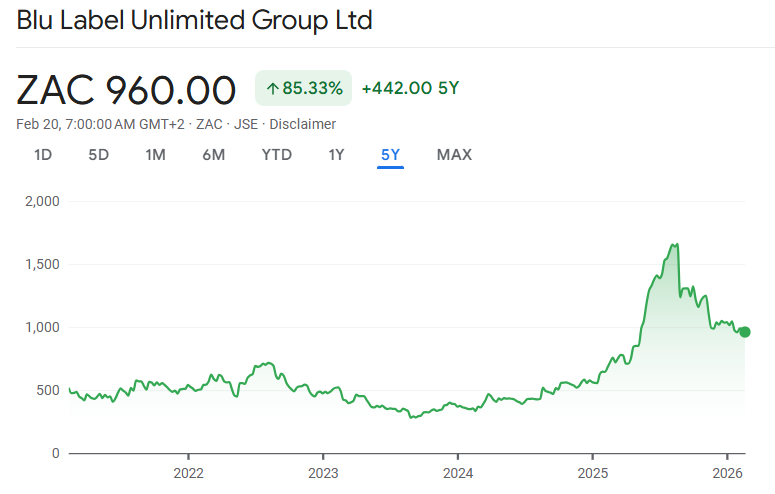
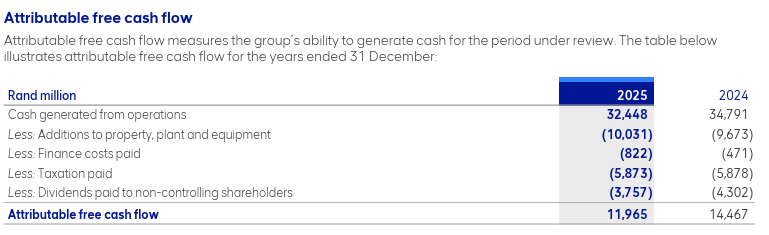
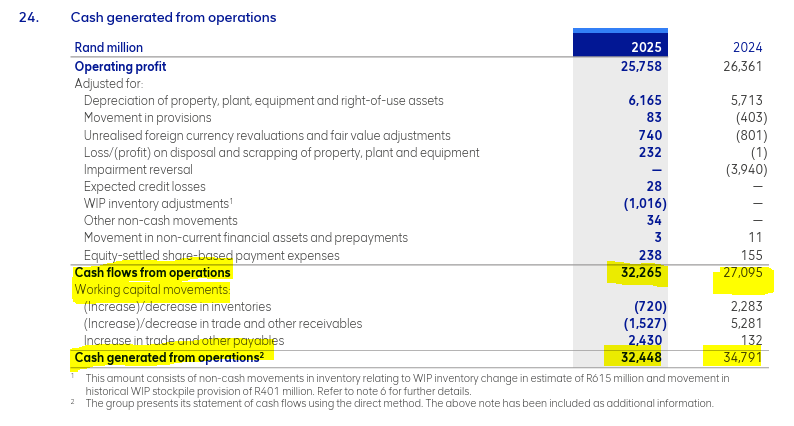
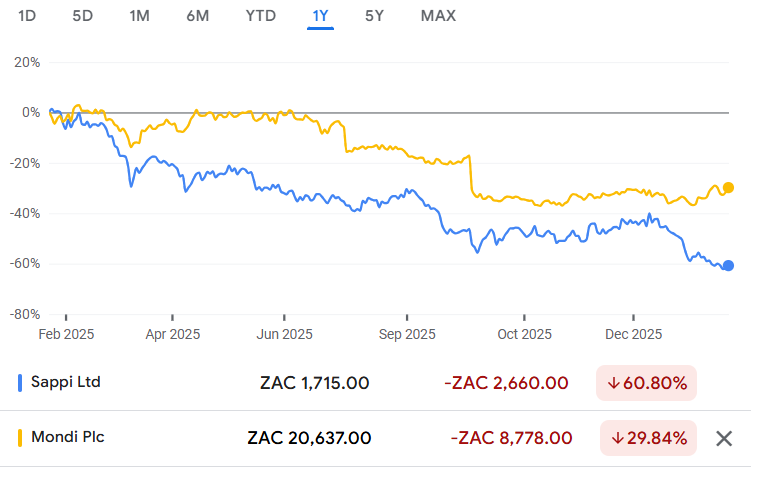
")

")
")