Design an incentive carelessly and people will follow it perfectly – straight off a cliff. Three centuries of history and a widespread current corporate mistake explain why.
Imagine for a minute that you are a British government employee, stationed in Delhi during the British Raj (that’s somewhere between 1858 and 1947, for those who don’t have their history books handy). You are concerned by the fact that the city is inundated with venomous Indian cobras, but you lack the manpower to tackle that many snakes yourself.
So, you turn to the local populace to help you hunt them down. With the Queen’s blessing, you offer a bounty to be paid for each dead cobra that is presented to you.
For a while, this appears to be going well. Locals bring you dead snakes, and you pay them. Everyone is happy except, possibly, the snakes, whose numbers are starting to decrease.
But after a few months of this, you notice something strange: it’s the same locals who come forward for payment every time, and even though they are presenting larger quantities of dead cobras, the amount of cobras in the city is starting to increase again.
Eventually, you catch on to the scam: the locals have realised that catching wild snakes is hard work (not to mention dangerous). It’s far easier to breed cobras at home and present them as legitimately wild-caught.
You immediately scrap the bounty, causing uproar among the populace of farmers-turned-cobra-breeders who were enjoying their steady income. With nothing to be earned from their stock, the locals release their broods of cobras into the wild.
You have spent a small fortune on paying bounties, and you now have more snakes than you had before. Her Majesty will not be pleased.
There is (unfortunately) no way to prove that this fun little anecdote is a true story. While the foundational narrative may be hard to prove, that didn’t stop economist Horst Siebert from using it as inspiration for a very real phenomenon that he coined “the cobra effect” – which has become shorthand for any situation in which people were unintentionally incentivised to make a problem worse.
The snakes are everywhere
The trouble with the cobra effect is that once you learn to see it, you start to find it everywhere. As Charlie Munger famously said, “Show me the incentive, and I’ll show you the outcome”.
In 2002, British officials tasked with suppressing opium production in Afghanistan offered poppy farmers $700 an acre in return for destroying their crops – a staggering sum in a country torn apart by war. Word of the programme spread fast. But the officials had measured the wrong thing. They were paying for destroyed crops, not for a smaller harvest – and so they got exactly what they paid for.
Farmers planted as many poppies as they possibly could, giving them more crops to destroy and more payments to collect. The craftier ones even managed to harvest and sell the valuable sap before ploughing the plants under, thereby getting paid twice for the same poppies – once by the drug trade, and once by the people trying to stop it. Even the most experienced investment bankers would be impressed by that!
In 2021, theUS Congress passed a law requiring sesame – a common allergen – to be clearly labelled on packaged foods, so that allergy sufferers could shop safely. Seems reasonable enough, but the law put food manufacturers in a bind. To sell a product as sesame-free, they now had to guarantee it. In order to be able to guarantee it, they had to scrub shared production lines and continuously test to keep even trace amounts out. That’s a serious expense.
The cheaper option was to give up and go the other way: dump a little sesame into the recipe on purpose, slap it on the ingredients label, and be done. The result was more products containing the allergen, now often added as flour rather than visible seeds, making it invisible to anyone scanning a bun or a biscuit for something they can spot.
A law designed to make food safer made it a lot more dangerous for the people that the law was trying to protect!
The cobra in the org chart
For the past couple of years, executives have been telling their boardrooms a simple story: workers are expensive; AI is cheap.
The strategy? Cut some of the workers, hand the survivors a set of AI tools to make them more efficient, and enjoy the same output at a fraction of the cost. The maths in the financial model (that was probably built using Claude) is irresistible.
Unfortunately, the workers who remain are not greeting their new AI tools with gratitude. Instead, they greet them with suspicion – and reasonably so, having just watched colleagues replaced by the very software they are now being told to embrace.
A 2026 working paper by Mark Ma and colleagues at the University of Pittsburgh tracked more than 3,200 firms alongside millions of employee reviews. It found that sentiment toward AI turns sharply more negative after a company announces AI-related layoffs, with job-security fears as the single loudest complaint.
That matters a lot, because the same research found that how employees feel about AI is one of the strongest predictors of whether AI actually makes their company more productive. This leads to a company with fewer people and a workforce too wary of AI to get much out of it.
And then comes the bill for the cleanup.
Having discovered that the AI can’t actually carry the load alone, companies are starting to hire the humans back. Staffing firm Robert Half found that nearly a third of companies that cut roles citing AI have already rehired for those same positions. Gartner projects that by 2027, half of the organisations that replaced customer-service staff with AI will do the same.
Add it all up and the ledger is bleak: the company has paid for AI consultants, then for the tech itself, followed by the cost of staff layoffs. Having been through a culture-destroying experience, they’ve then paid to hire them back. The most cynical view is that all these costs end up creating a resentful workforce where the layoffs meant to unlock AI’s value are precisely what buried it.
That is the cobra effect in a modern suit.
You wanted a leaner, faster company. Instead, you taught your own staff to resent the tool that was supposed to save you, crushing years of culture and loyalty along the way.
This doesn’t mean that all AI projects are doomed to fail, of course. It just means that with the wrong incentivisation, you’ll be going from Copilot to cobras faster than you can read the AI-generated restructuring proposal that got you into trouble.
Her Majesty will not be pleased with such a poorly designed reward system. People know exactly how to optimise what you give them. That doesn’t mean that you’ll get the outcome you asked for.
But you will always, always get the one you incentivised.
About the author: Dominique Olivier
Dominique Olivier uses her love of storytelling and ideation to help brands solve problems.
Her first book, Lessons from Loss, has been published by Penguin Random House.
She is a weekly columnist in Ghost Mail and collaborates with The Finance Ghost on Ghost Mail Weekender, a Sunday publication designed to help you be more interesting.
Rainbow Chicken’s earnings are as volatile as ever
Why I don’t have a position in Truworths (JSE: TRU)
The latest results reveal the growth problem
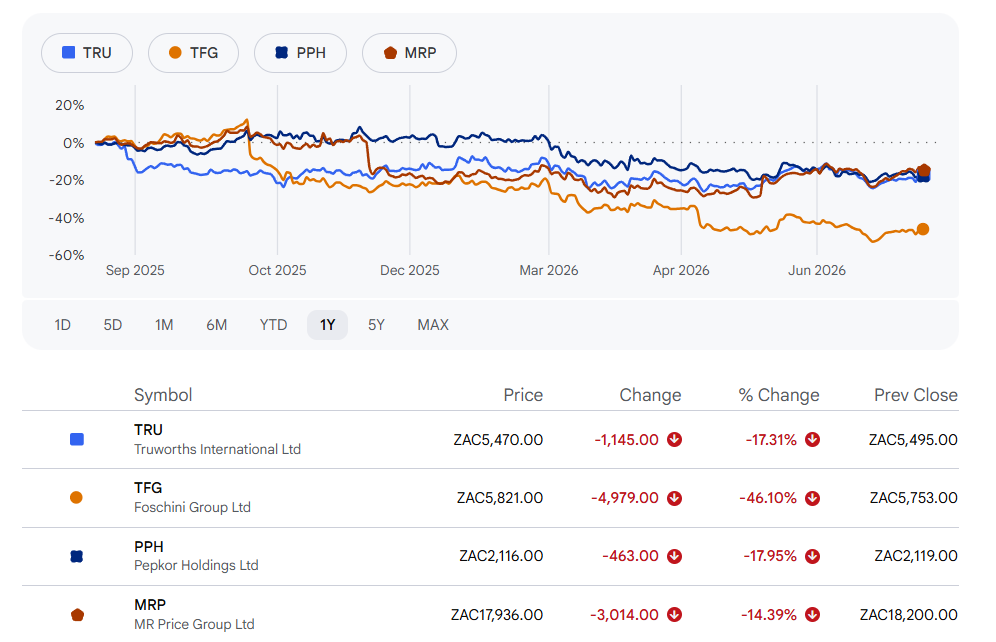
The Truworths share price is down 3.6% this year. If you haven’t been following the sector closely, it may shock you to learn that this is one of the better outcomes in clothing retail!
It comes down to expectations vs. reality. Truworths has been so weak over the years that the market really hasn’t expected much, so the valuation unwind hasn’t been as severe as we’ve seen at previous darlings like The Foschini Group.
Here’s a view on the sector over 12 months:
There are absolutely no winners here. Glancing at this chart is like seeing a bunch of SALE signs at the end of the season.
Even a strong dividend yield (a whopping 9% at Truworths) can’t shield investors from this kind of trauma.
What can we learn from the latest numbers?
In the 52 weeks to 28 June 2026, there’s more disappointment for Truworths shareholders. Even without a demanding valuation, nobody wants to see a 0.9% decline in group retail sales for the period. HEPS is expected to be down by between -2% and -4%.
To make it worse, the momentum during the period is particularly poor. The group managed flat sales in the first half of the financial year, while the second half suffered a decline of 2.1%.
That’s because the second half suffered from the same issue that is plaguing the broader retail sector: the impact of the conflict in Iran on consumer affordability. Our money has been redirected from the malls to the petrol pumps.
When we dig into the segments though, you may be surprised by the shape of the geographical split.
South Africans are a tough bunch
Truworths Africa is where you’ll find an unusual outcome. Despite the petrol price making everyone bleed in uncomfortable places, Truworths Africa had a better H2 (-0.1%) than H1 (-3.6%). This equates to a full-year performance of -2.1%.
Cash sales bore the brunt of the pain, down -5.0% for the year. Account sales fell by -0.9%, with approval rates for account sales dipping from 79% to 77%. They talk about having a more “prudent approach to credit granting”. You can refer to my detailed piece on Weaver Fintech for great insights into the state of lending to South African consumers.
Despite all the inflationary pressures out there, Truworths Africa actually experienced deflation of -0.4% for the period (vs. inflation of +1.2% in the prior period). When growth in volumes isn’t coming through during a period of weak pricing, deflation becomes a huge issue for retailers.
At least online sales moved in the right direction, up 21.5% at Truworths Africa and now contributing 8.1% to retail sales (up from 6.5% a year ago).
Despite all the local challenges, Truworths Africa still increased trading space by 0.8% – an acceleration from the 0.5% growth in 2025.
A nasty slowdown in Office UK
Unlike its peer group, Truworths has been doing relatively well offshore vs. the local business. Admittedly, part of this is because Truworths Africa is just so poor.
This leaves Truworths shareholders vulnerable to a slowdown in Office UK. It seems to be happening, with growth of 6.4% in H1 firmly in the rear-view mirror. Growth was just 2.9% in H2. Full-year growth was 4.9%. These rates are all in local currency (i.e. GBP).
If you translate the numbers to rand, then the reported growth was just 1.3% for the full year. Gone are the days of local companies relying on an ever-depreciating rand to boost the value of offshore earnings.
Online shopping adoption is much higher offshore than locally, evidenced by online sales contributing 44.7% of Office UK sales (down from 44.9%).
Despite the growth narrative being weak in the UK, the Office business has gone on quite the expansion drive. Trading space increased by 17.8%, or 8.1% on a weighted average basis.
Overall, Office UK did a good job of outperforming the market. The problem is that the market will extrapolate the slowdown and feel concerned about where the growth will come from.
My view
I don’t invest for the dividend yield. In fact, I actively avoid slow-growth companies that promise great dividends. Inevitably, the dividends don’t withstand the underlying pressure on earnings.
Pepkor is my chosen player in this sector. I love the fintech / banking upside. I’m stuck in Mr Price in the aftermath of the NKD deal unfortunately, but at least they are also finding ways to grow.
I can’t bring myself to feel excited about Truworths. I also can’t get past the risks that The Foschini Group is facing offshore, so that’s off my list as well.
Rainbow Chicken’s earnings are as volatile as ever (JSE: RBO)
There ain’t no business like the chicken business
Rainbow Chicken released a trading statement for the year ended June 2026. As is often the case in this sector, there are some utterly insane percentage movements at play here.
The poultry business is characterised by low net profit margins and volatile gross margins. In practice, a small change to gross margin can drive a substantial change in net margin.
Let’s do an example
To just use hypothetical margins, let’s assume that your gross margin is 20% and your profit before tax margin is 5%. A 200 basis points deterioration in gross margin can easily happen if you have a spike in input costs, pressure on consumer spending or issues with bird flu.
It may not sound like much (we are talking 200 basis points on 20% here, or a 10% deterioration), but that move in gross margin will drop profit before tax margin from 5% to 3% (all else held equal). Assuming constant sales, that’s a 40% drop in profit before tax!
And believe me, gross margin can move by a lot more than 200 basis points.
Earnings have more than doubled
This is why the year ended June 2026 has seen a jump in HEPS of between 118% and 138%. Earnings more than doubled!
A combination of strong demand for poultry products, lower commodity prices and operational efficiencies delivered the goods here.
I prefer to eat the stuff
The poultry sector is far too terrifying for me. I can’t bring myself to be invested in stocks that oscillate between incredible earnings growth and near-death financial experiences.
I’ll stick to eating chickens rather than investing in them.
Weaver Fintech’s results are important enough for my portfolio and for the broader consumer economy to have warranted a much deeper dive than you’ll usually see in Ghost Bites. Enjoy it!
Lots of head scratching for investors in Weaver Fintech (JSE: WVR)
And that includes me
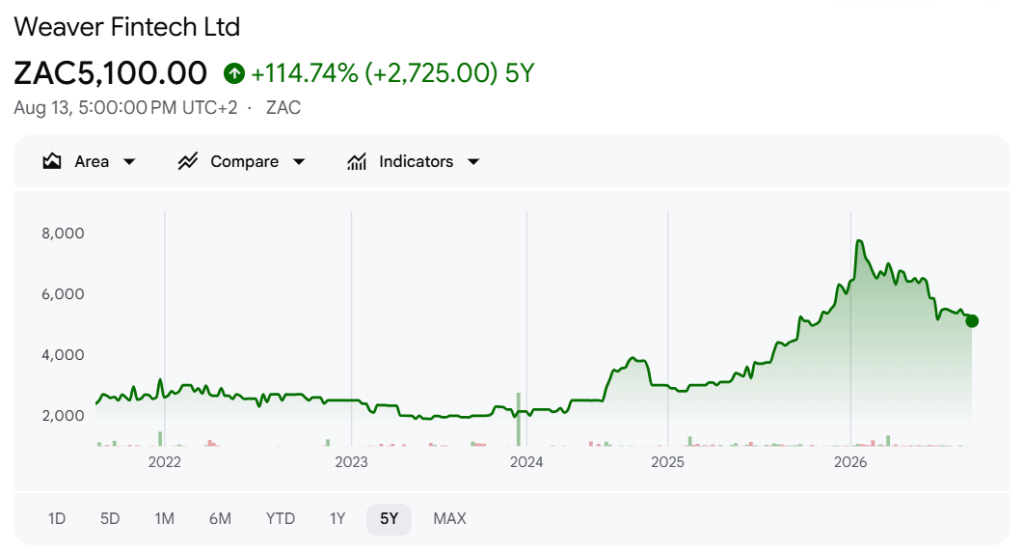
Weaver Fintech is one of the positions in my local portfolio. Even after a sharp correction, I’m still up 70%. I’ll take it!
Here’s what the chart looks like:
Why am I long here?
My underlying thesis is simple: BNPL is a fast-growing space, and PayJustNow (the Weaver business) has the leading position.
Yes, they have a zillion competitors snapping at their heels, so caution around growth prospects is always warranted. But because this is South Africa rather than the US, I was able to buy a growth company on a single-digit P/E multiple!
Looking at SA tech vs. US tech is like comparing Joburg and Cape Town house prices. There are some very good reasons for the difference in valuation, but that doesn’t mean that SA (or Joburg in the house price analogy) doesn’t offer opportunities.
Weaver has now released results for the six months to June 2026 that gave the market (and me) a lot to chew on.
Farewell, interim dividend
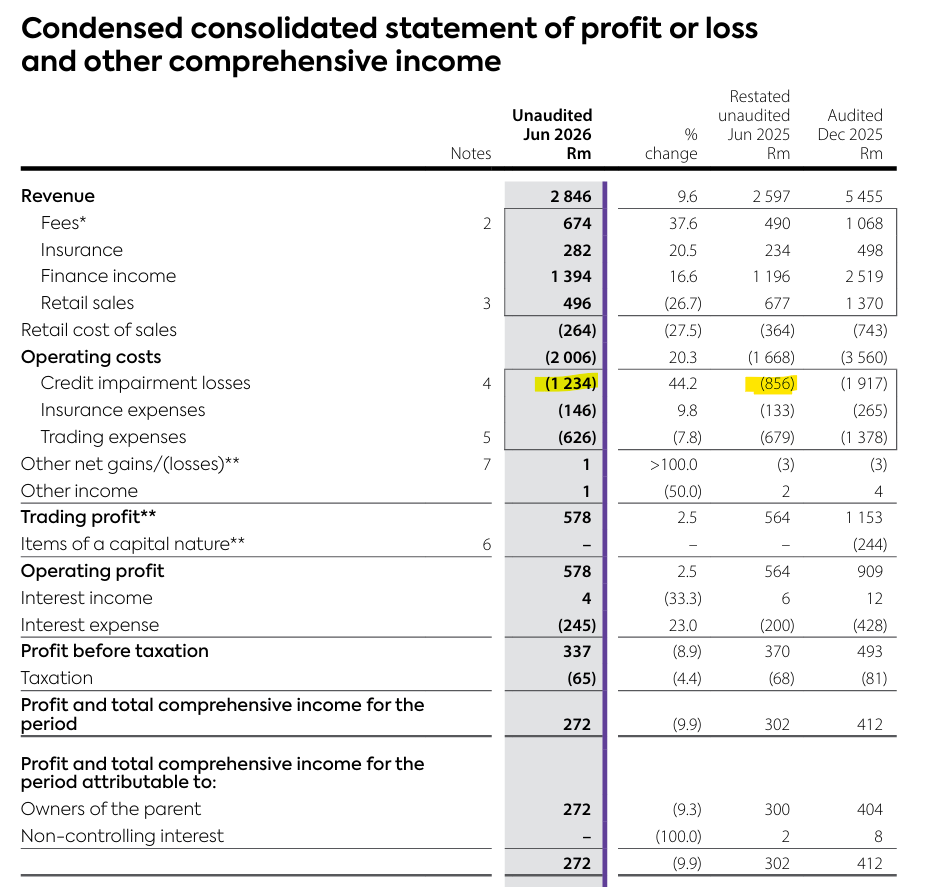
Although customers increased by 17% and revenue was up 10%, trading profit only grew by 2%. Even worse, profit before tax was down by 9%. What happened to Weaver being a growth company?!?
Here’s perhaps the most concerning comment of all:
“The board has elected not to declare an interim dividend for the six-month period to 30 June 2026, to preserve capital while credit normalises.”
A quick look at the income statement will reveal the problem in credit impairments:
Yes, that’s a 44.2% increase in impairment losses during a period in which revenue increased by only 9.6%. Ouch!
Caution is warranted
Now, we know that local consumers are under pressure. Local retailers have been having a tough time. But has the tide finally gone out during the period in which fuel costs assaulted our budgets? Heck, even the SARB was too scared to hike rates!
Weaver is certainly taking a more cautious approach than before. The provision rate in the Fintech book was raised from 14.7% to 17.3%. The credit loss ratio jumped from 21.2% to 24.7%. The company has increased the number of collection agents by 24%.
The company applied the brakes to disbursements in response to the deteriorating consumer credit environment. Growth in disbursements slowed to 10% in this period (vs. 30% a year ago). The slowdown is even more obvious if we look within the interim period: disbursements grew by just 6% in Q2 vs. 15% in Q1.
They seem to be scrambling to get the book under control, with a need to stabilise it before they can achieve further scale in the business.
Even during a difficult period, collections exceeded disbursements by R270 million. That’s comforting for investors, with the excess reinvested into the business in this period (growth in receivables exceeded additional net debt by R400 million). This means they can grow without relying fully on external debt. By scrapping the interim dividend, they’ve held on to even more cash to shore up the balance sheet.
Conservatism is what I want to see here.
Understanding Fintech vs. Retail
It’s important to understand that Weaver’s Retail segment isn’t the money-spinner that got the market’s attention in recent years. For context, the Fintech business makes 94% of trading profit!
The Retail segment operates the homechoice banner, which has been around for a very long time. They’ve recently shifted away from cold calling customers, with primary focus being on showroom-based customer acquisition. Showrooms now source 65% of new customers, up from 40%. The key point to understand is that homechoice is really just a front door for the Fintech segment, as this is one of the ways that they win customers in a hotly-contested space.
The Retail segment suffered a 27% decline in sales in this period. The profits in that segment were saved by a 60 basis points improvement in gross margin to 46.8%, along with a 30% decrease in the cost base. This allowed trading profit to increase by 15%.
The Fintech segment can’t say the same unfortunately, with trading profit up by just 1% as the credit deterioration ate up profits.
The risk in the lending business needs to be watched carefully
The Fintech segment grew transacting customer numbers by 33%. Fintech revenue was up 30%, with core lending revenue up by 21%. That looks like a balanced relationship, with the issue clearly not being the adoption of the ecosystem by South African consumers.
After all, with retailers taking a more cautious approach to lending, why wouldn’t customers try their luck with getting credit from Weaver?
For those among you who are operating tech businesses, you’ll be interested to know that the cost of acquiring a customer is R60. The average lending customer transacts 6.6 times per year, while the average BNPL customer (3-month debt) transacts 5.1 times per year. Once they’ve gotten a consumer into the ecosystem, it’s all about retention and maximising the lifetime value of that customer.
The focus on cross-selling raises other interesting questions though.
I would see the PayStretch book (12-month customers) as being far riskier than the BNPL book. If Weaver does too much cross-selling, they risk taking the business into a place where it is seen as just another microlender vs. being an appealing ecosystem.
But the bigger risk lies in the even longer-dated stuff, with the lending book averaging 19 to 21 months. I’m glad to see that the disbursements are focused on bringing this down significantly, with the average disbursed loan term reduced from 13.1 months to 12.6 months.
A non-banking business that doesn’t have access to cheap deposits shouldn’t be trying to do longer-dated loans in South Africa.
Another important risk-management point is that PayStretch depends on the pre-qualified BNPL base, so Weaver has experience with these customers before extending loans to them. At a time when retailers are providing a conservative narrative around credit sales, Weaver happily grew its PayStretch gross merchandise value by 215%. It may be off a low base, but that’s something to keep an eye on.
An ecosystem built around cross-selling
It’s great to see merchant advertising coming through as a proper revenue engine. Advertising revenue increased by 17.4%, with Weaver appealing to FMCG players looking to access an ecosystem of customers who have intent to transact (and access to debt to do so).
Together with capital-light fee income on transactions (vs. only earning lending income), this advertising income is a good example of how Weaver will look to drive Return on Equity over time.
Another exciting area is the planned launch of PJN Mobile in Q2, the type of MVNO partnership that we’ve seen across numerous retail and banking players. If you have a large cohort of customers, then sending airtime and other services in their direction is a great way to add to the bottom line.
Insurance income is another important opportunity, with customers up 28% and gross written premium increasing by 18%. They focus on ways to make cross-selling easy, like adding family members to an existing funeral policy in the PayJustNow app. As a reminder that Weaver’s business has been around for many years before they acquired PayJustNow, only 53% of new policies were acquired digitally (up from 49% before). Don’t underestimate the distribution power of the homechoice retail network.
The prize for taking that risk is clear: Weaver notes that a single-product customer generates an average of R678 in revenue vs. a fully cross-sold customer (7 products!) at R18,431.
Driving better unit economics
To build out this ecosystem, Weaver increased its investment in AI capabilities by 54%. One of the measures of efficiency is the unit cost of customer service interactions, which fell by 25%.
Overall, the ratio of expenses to revenue improved from 25% to 23%.
Improving unit economics is what you would expect to see as a platform scales. You’ll often hear people talk about a strong “contribution margin” – the benefit of having one more customer.
My approach
Every investor has a different approach. I like having long-term positions built around specific themes, with enough diversification in my portfolio that I’m not betting the farm on one specific stock or idea.
Weaver is approximately a 2% position in my portfolio. I’m comfortable with just leaving it alone to do its thing and I appreciate management’s conservatism during a difficult period.
For the sake of the entire SA consumer sector, I hope that fuel prices will offer some relief in the second half of the year. I also hope that the SARB keeps their fingers far away from the rate hike button!
The increased momentum witnessed in the second half of 2025 was stalled in February 2026, with the outbreak of the latest Middle East conflict. Despite repeated efforts to broker a ceasefire, the conflict continues, adding further uncertainty to an already complex global environment. Against this backdrop, South Africa’s economic growth remains stubbornly low, with growth forecast by the IMF at just 1.1% for 2026. Unsurprisingly, corporates and investors, faced with a challenging geopolitical landscape and a difficult domestic operating environment, have adopted a wait-and-see approach.
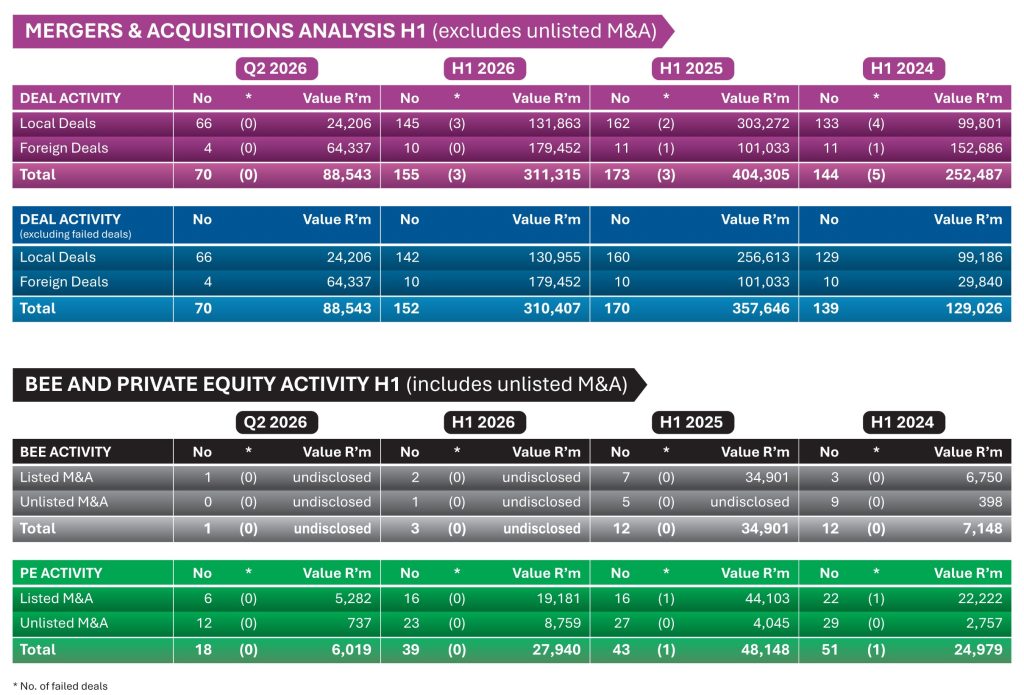
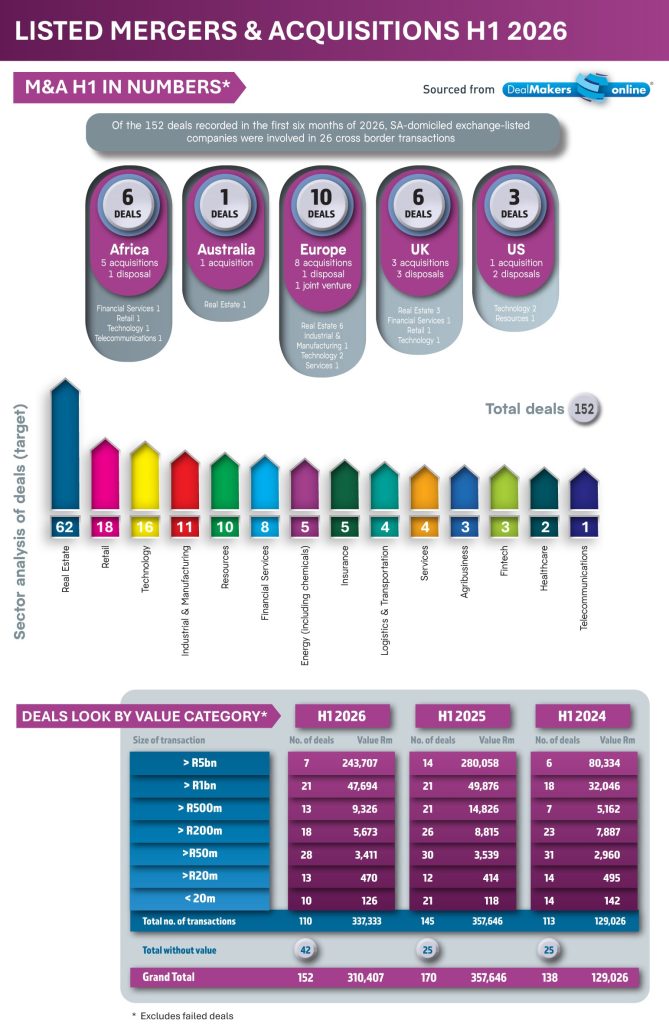
Deal activity in H1 2026 reflects this caution, with deal flow down 10% year-on-year to 155 deals valued at R311bn. Stripping out transactions involving foreign companies with secondary listings on one of the local exchanges and failed deals, the picture remains subdued, with only 142 deals recorded, against 160 in H1 2025. The decline is evident across the various deal categories. DealMakersrecorded just three BEE transactions involving exchange-listed and unlisted companies in the six months to the end of June, compared with 12 in the corresponding period in 2025. Private equity activity has proved somewhat more resilient, with 39 deals recorded, compared with 43 in H1 2025.
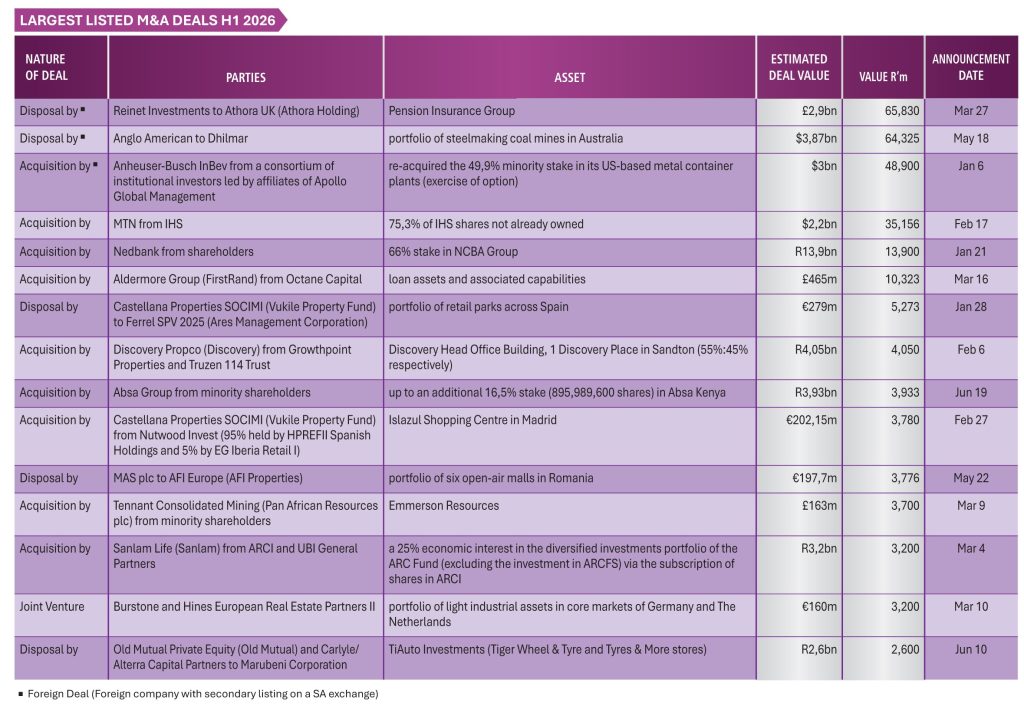
Interestingly, the majority of the top 15 deals by value in H1 2026 were announced in Q1, with the three largest transactions involving companies with secondary listings in South Africa. Of the aggregate R271,9bn value represented by the top 10 deals, these three transactions accounted for 66% of the total – highlighting once again the extent to which a handful of large transactions can influence the headline numbers.
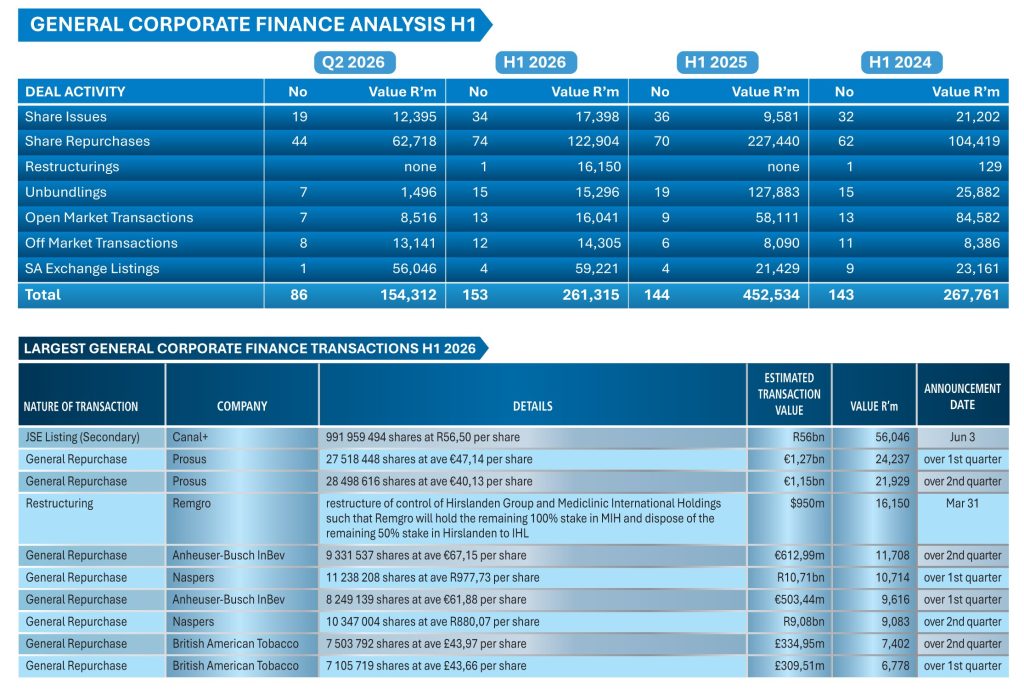
South Africa’s capital markets, however, have remained resilient. Accelerated bookbuilds by JSE-listed property companies increased in H1 2026, driven by strong institutional demand. Significant capital raises were undertaken by Spear REIT, Fairvest, Vukile Property Fund and Fortress Real Estate, which together raised R6,05bn over the period. Corporates also continued to return capital to shareholders through share repurchases, with a total value of R122,9bn recorded.
So, what can we expect in H2 2026? While advisory firms remain busy and the pipeline appears active, getting transactions across the line will remain challenging. The consequences of the Middle East conflict continue to reverberate across global markets, weighing on growth, disrupting supply chains, putting pressure on energy prices, and fuelling inflation.
Unless there is a meaningful resolution to the conflict and a corresponding improvement in global economic sentiment, it is unlikely that the momentum in deal activity seen in the second half of 2025 will be replicated in 2026. For now, caution remains the prevailing sentiment – and patience may well prove to be the defining characteristic of the M&A market in the months ahead.
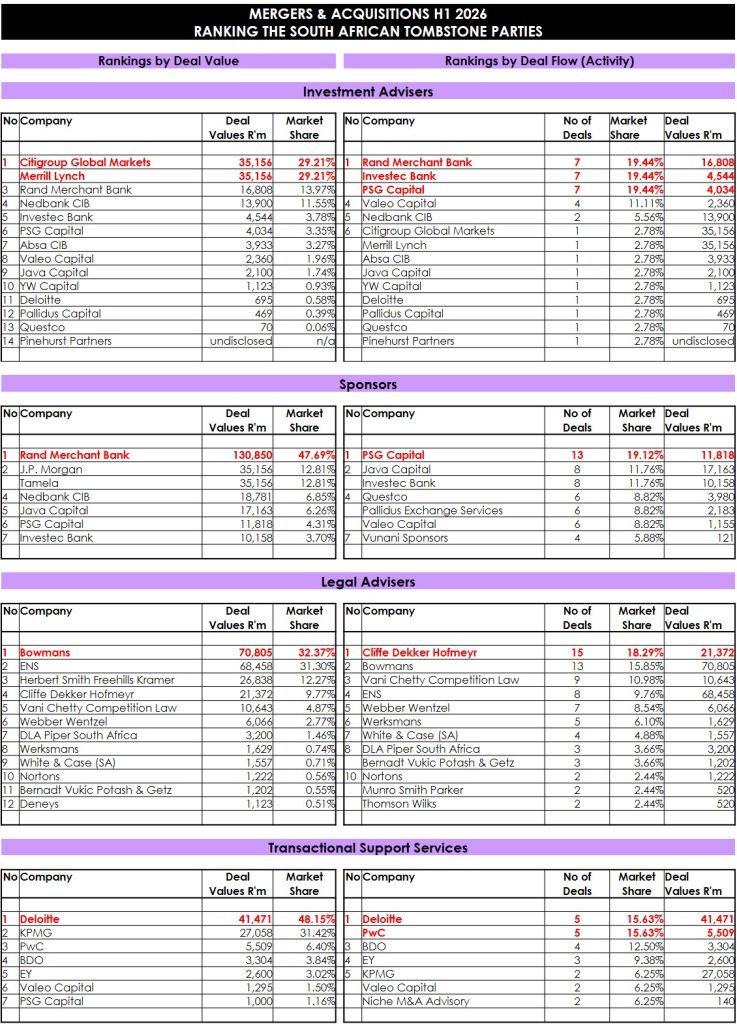
DealMakers H1 2026 League Table – M&A activity by the top South African advisory firms (in relation to exchange-listed companies).
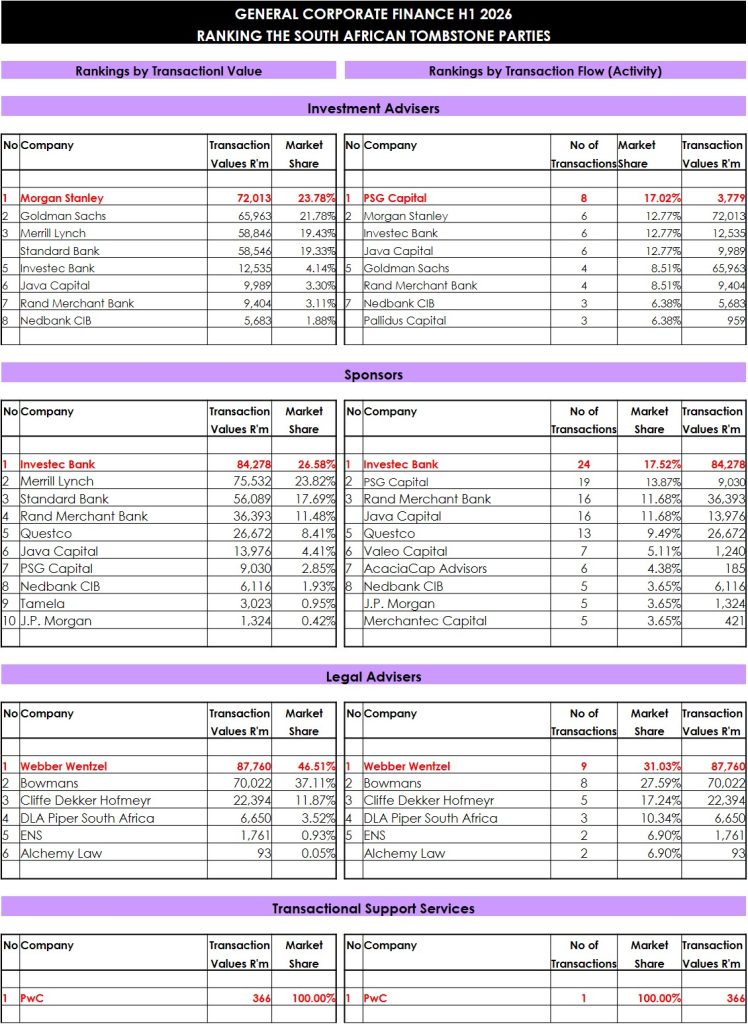
DealMakers H1 2026 League Table – General Corporate Finance activity by the top South African advisory firms (in relation to exchange-listed companies).
DealMakers is SA’s M&A publication. The latest magazine can be accessed as a free-to-read publication on the DealMakers’ website www.dealmakerssouthafrica.com
NEPI Rockcastle is to acquire MegaPark Barakaldo, an c.81,000m² shopping destination located in Bilbao, Spain from Le Retail Hiper Ondara for a gross purchase consideration of €254 million. The acquisition will be funded from available cash resources and existing undrawn credit facilities.
Jubilee Metals has received two binding offers for the sale of its Zambian Large Waste Project at a substantial premium to its original acquisition price. Jubilee originally acquired the asset for c.US$18 million. To clear the outstanding $5 million (£3,8 million) owed to the original seller, Jubilee will issue 150,5 million new ordinary shares at 2.5 pence per share. The company plans to select a preferred bidder within the next two weeks. Funds received will be use towards accelerating its copper growth strategy in existing, lower-risk operations.
In the release of its interim results to end June 30, 2026, Resilient REIT advised shareholders that it had signed agreements to acquire the remaining 50% of Mams Mall and The Village Klerksdorp for undisclosed sums.
Unlisted Companies
Zazi Capital has acquired the 20.82% stake in UsPlus held by Baleine Capital. The transaction was settled in cash and implies and equity value of c.R166 million for UsPlus. A developmental finance organisation, UsPlus specialises in the provision of flexible working capital solutions for SME partners throughout South Africa.
Local AI business intelligence platform Tennsa, has closed a raise of c.R1 million from Oakvale Invest. Cape-based Tennsa builds AI software aimed at small and medium-sized businesses. Tennsa OS is an operational intelligence layer that connects to the systems a business already runs, monitoring for issues needing attention and providing information to assist owners make faster operating decisions.
MC Mining has secured further capital support from Kinetic Development Group (KDG). KDG will subscribe for 76,591,672 new shares in the company for an aggregate subscription amount of US$16 million to be subscribed for in two equal tranches at an issue price of $0.2089 per share. The new funding will, in part, be applied towards the business operations and working capital requirements including the continued development and commissioning of the Makhado project.
Brait successfully raised R2,5 billion via a renounceable rights offer to qualifying shareholders. As the offer was fully subscribed (taking into account the excess applications received), the underwriters were not required to subscribe to shares in terms of their commitments.
Novus has acquired an additional 3,495,226 Mustek shares at an average R15.25 per share on the open market (outside of the Mandatory Offer) for c.R53,25 million. The company now holds 29,87 million Mustek shares constituting 51.91% of the issued shares in Mustek. Together with concert parties this shareholding increases to c.72.20%.
Jubilee Metals will issue 150,5 million new ordinary shares at 2.5 pence per share to settle the £3,8 million (c.R82 million) owed on the acquisition by the company of the Large Waste Project in Zambia. The shares represent 4.5% of the enlarged issued share capital of the company.
This week the following companies announced the repurchase of shares:
Reinet Investments has commenced its proposed 7th share buyback programme. The company intends to purchase its ordinary shares at market value for an aggregate maximum amount of €250 million subject to a maximum of 8 million ordinary shares over a period commencing 18 August 2026 and ending on 15 December 2026 at the latest. The shares will not be cancelled.
Investec Ltd announced in November 2025 that it would commence the repurchase and cancellation of some of the non-redeemable, non-cumulative, non-participating preference shares. This week the company announced that over the period 19 March to 5 August 2026, a further 401,798 preference shares were repurchased at an average price per preference share of R96.28 for an aggregate R38,69 million.
In March 2026, Quilter commenced a £100 million share buyback programme, to reduce the share capital of the company and return capital to shareholders. The maximum aggregate purchase price payable by the company under Tranche 2 is up to C.£30 million. During the period 3 to 7 August 2026, Quilter repurchased 75,000 shares on the LSE with an aggregate value of £148,424 and 15,000 shares on the JSE with an aggregate value of R654,860.
In June 2026, Greencoat Renewables announced its intention to commence a second tranche of the repurchase programme to return a further €25 million of capital to shareholders. The second tranche repurchase will be complete by end-December 2026. This week 533,458 shares were repurchased for an aggregate €415,602.
Bytes Technology announced in May 2026 its intention to implement a new share repurchase programme to purchase the company’s shares for an aggregate value of up to £25,0 million. This week the company repurchased 345,000 shares at an average price per share of £3.32 for an aggregate £1,23 million.
British American Tobacco has again extended its share buyback to end on 12 October 2026. All shares repurchased will be cancelled. Over the period 3 to 7 August 2026, the company repurchased a further 710,000 shares at an average price of £44.30 per share for an aggregate £31,45 million.
Ninety One plc announced an increase in the repurchase programme from £30 million to £55 million. The shares, to be purchased on the open market, will be cancelled to reduce the Company’s ordinary share capital. On 3 August 2026, the company repurchased a further 102,335 ordinary shares at an average price 214 pence for an aggregate £219,506.
Anheuser-Busch InBev’s US$6 billion share buy-back programme continues. The shares acquired will be kept as treasury shares to fulfil future share delivery commitments under the group’s stock ownership plans. Over the two days of 6 and 7 August 2026, the group repurchased 196,030 shares for €14,45 million.
During the period 3 to 7 August 2026, Prosus repurchased a further 1,790,596 Prosus shares for an aggregate €74,52 million and Naspers, a further 641,547 Naspers shares for a total consideration of R577,02 million.
Eight companies issued profit warnings this week: Spur, Aveng, MTN, Italtile, Grindrod, Cilo Cybin, Sebata and Truworths International.
Two companies renewed cautionary notices: Trustco and Mantengu.
e-Finance for Digital and Financial Investments has acquired Tamweely, a MSME and non-banking financial services provider in Egypt, from a consortium of investors comprising SPE PEF III (SPE Capital), the European Bank for Reconstruction and Development (EBRD), Tanmiya Capital Ventures (TCV) and British International Investment (BII).
The International Finance Corporation (IFC), the private sector arm of the World Bank Group, is investing US$25 million in equity in Jumia Technologies AG (Jumia), a pan-African e-commerce platform, with operations across eight African countries.
Fortuna Mining Corp has announced the acquisition of the 190 km² Bambadji advanced gold exploration project in Senegal, through the purchase of certain Senegalese subsidiaries held by Barrick Mining Corporation and IAMGOLD Corporation. The US$200 million consideration was paid in cash and Fortuna has granted the sellers a 0.5% net smelter return royalty on the first 1,75 million ounces of gold produced from the Bambadji Nord property.
African Development Bank Group has approved a US$255 million loan from the African Development Fund and a $10 million grant from the Rome Process/Mattei Plan Financing Facility to support Zambia’s participation in the Lobito Corridor development initiative. The Lobito Corridor spans Southern and Central Africa, linking Angola, the Democratic Republic of the Congo and Zambia from the Port of Lobito to the Copperbelt region.
Continental Holdings became the 17th company to list on the Malawi Stock Exchange on 10 August 2026 following the close of its IPO which had a 93% subscription rate. A total of 701,834,576 shares were allotted of the 753,308,604 on offer, raising MWK135,5 billion.
Why focus has become the new currency of value creation in consumer packaged goods
If you spend enough time in the boardrooms of consumer packaged goods (CPG) companies, you’ll notice that the conversation has changed.
A decade ago, strategy discussions centred on growth: new markets, broader diversification and bigger portfolios. Today, those same boards are asking different, more fundamental questions: “What should we own?” And more importantly, “What shouldn’t we own?”
This subtle shift reveals a massive transformation in where the global consumer sector is heading.
For decades, massive scale was regarded as the ultimate competitive advantage. Companies assembled sprawling portfolios spanning multiple categories, believing diversification would reduce earnings volatility and strengthen retailer relationships.
Today, investors are increasingly wary of businesses that are too diversified.
What was once celebrated as diversification is now penalised as dilution and unnecessary complexity. Portfolios that span categories with limited strategic overlap leave companies with fragmented equity stories, split management time, and a mosaic of reporting segments that few analysts fully understand.
The rise of the pure-play investor
Perhaps the biggest driver of this change has occurred within shareholder registers.
Institutional investors today have seamless access to virtually every listed market in the world. They can construct their own diversified portfolios across sectors and geographies with ease. If an investor wants exposure to both confectionery and pet food, they can simply buy specialist companies; they no longer need corporate management teams to diversify on their behalf.
The market is not subtle in its preference: it pays for focus, and discounts complexity. Category-leading, focused businesses consistently trade at higher multiples than diversified peers with comparable earnings. Shareholders can diversify their own portfolios, but they cannot outsource good capital allocation. Consequently, the value of a management team is now measured by the quality of their decisions about what to own, what to exit, and where to reinvest.
Case studies in corporate simplification
Viewed collectively, recent global corporate actions point towards a broader macroeconomic shift – The Great Simplification.
Consumer giants are sharpening their focus through a two-pronged approach: exiting non-core brands while doubling down on platforms where they possess a distinct competitive advantage.
Kellanova & WK Kellogg: Kellogg’s decision to separate its mature North American cereals from its fast-growing global snacking business proved that distinct operations no longer need to coexist under one corporate structure. This act of simplification unlocked substantial shareholder value, culminating in Mars acquiring Kellanova at a significant premium to deepen its existing global snacking leadership.
Unilever & ABF: Driven by sharpening shareholder scrutiny, Unilever recently completed the demerger of its ice cream business and combined its food division with McCormick & Company. This effectively positions Unilever as a pure-play home and personal care (HPC) business. Similarly, Associated British Foods (ABF) announced the demerger of its fashion retailer, Primark, to reposition ABF as a high-quality, pure-play food business.
Nestlé & Kraft Heinz: Nestlé has systematically reshaped its portfolio over the last decade, exiting slower-growth brands to direct capital toward high-margin pillars like coffee and pet care. Even Kraft Heinz, created through one of the largest consolidation mergers in consumer history, continues to evaluate portfolio optimisation, proving that scale alone is no longer enough.
South Africa follows suit
Global themes have a habit of finding their way to South African boardrooms, and the local market is beginning the exact same journey.
Tiger Brands provides the clearest local case study.
In recent years, management has systematically restructured its portfolio by disposing of non-core assets. This has allowed the group to focus capital and resources squarely on categories where it holds dominant competitive positions, driving up returns on invested capital. Crucially, this strategy is not about becoming a smaller company; it is about becoming a better, more efficient one.
Similarly, Premier Group’s acquisition of Rhodes Food Group (RFG) highlights the secondary phase of M&A strategy.
While the transaction expands platform scale, it inevitably compels management to re-evaluate the newly merged portfolio. Transformational acquisitions naturally trigger critical questions about which businesses warrant incremental capital allocation and which assets have ultimately become non-core.
A new era for consumer M&A
If this trend continues, the next decade of consumer M&A will look fundamentally different from the last.
While the previous cycle was characterised by consolidation, the next will be defined by rigorous portfolio optimisation, corporate carve-outs and strategic divestitures.
For corporate advisors and investment bankers, this fundamentally changes the nature of strategic dialogue. Historically, conversations began with a simple question: “What should we buy?” Today, the question gaining real traction in the market is: “What should we sell?” Often, the answer to this second question delivers far greater long-term value to shareholders.
The Great Simplification does not mean downsizing.
It means becoming targeted, intentional and disciplined. For those advising on these vital boardroom decisions, this trend will undoubtedly define the M&A landscape of the coming decade.
Cara Pardini is a Corporate Finance Transactor, Brendan Grundlingh a Sponsor Client Director and Gareth Armstrong a Corporate Finance Executive |RMB
This article first appeared in DealMakers, SA’s quarterly M&A publication.
Grindrod’s HEPS falls flat for the six months to June 2026
Brace yourself for a wild move in Impala Platinum’s earnings
The market celebrated the latest Shoprite update
Still to come in a later edition of Ghost Bites: Resilient REIT and Weaver Fintech
Grindrod’s HEPS falls flat for the six months to June 2026 (JSE: GND)
And the market doesn’t like it
Grindrod’s trading statement for the interim period ended June tells a story that the market hasn’t appreciated.
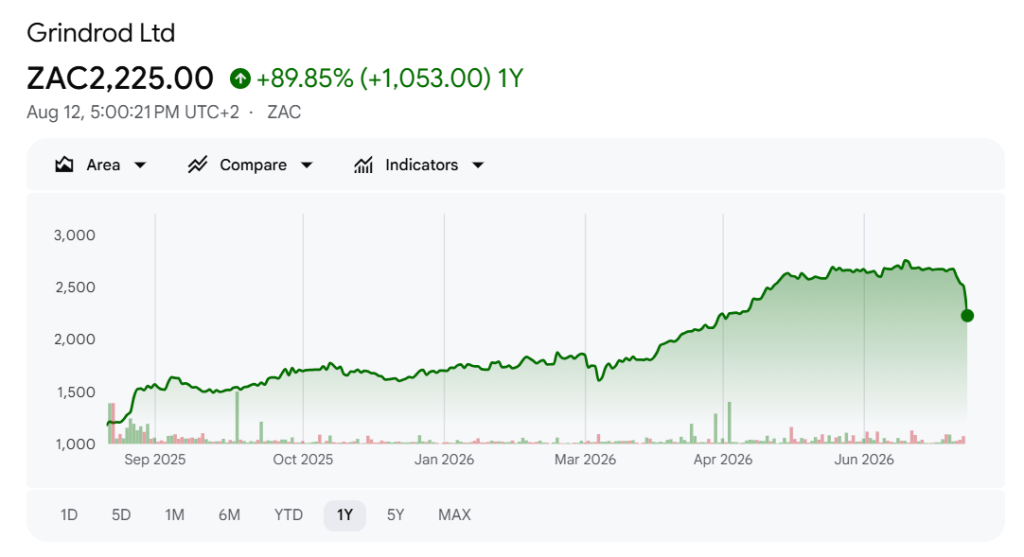
The guidance for HEPS is a movement of between -4.2% and +4.3%. At the mid-point, that’s an almost perfectly flat performance. With the share price closing 11.4% lower on the day, it’s clearly not what the market wanted to see from a company that has pulled off quite the turnaround story.
There’s an old saying in the market that bulls take the stairs and bears ride the elevator. It means that share price gains are usually incremental in nature, while declines tend to be sharp. The Grindrod chart is literally a textbook example of this:
Ghost Bite: Detailed results are due for release on 25 August. That’s a chart that is light on support levels at anything close to the current price, so it could be a very choppy couple of weeks.
Brace yourself for a wild move in Impala Platinum’s earnings (JSE: IMP)
Even by PGM standards, this is a monsterof a swing
Impala Platinum’s trading statement for the year ended June 2026 reflects an astonishing jump in HEPS. They expect to come in between R24.29 and R26.52 per share. In the comparable period, it was just R0.82 per share. That’s an increase of roughly 31x at the mid-point of the range!
There’s obviously a base effect here, particularly as the group was only marginally profitable in the prior year. But there’s also the impact of a far more favourable PGM market, which in turn drove a 51% improvement in achieved revenue per 6E ounce. Add on a 5% increase in refined and scalable production and you get fireworks.
The 8% increase in group unit costs per ounce was no match for the jump in revenue. This is why much of the benefit from higher pricing and production dropped to the bottom line.
Group EBITDA was R43.6 billion and free cash flow was R22 billion. It’s incredible to compare this to the EBITDA of R919 million and free cash flow of R2.35 billion in the comparable period.
Ghost Bite: This is perhaps the ultimate example of how earnings can swing in this sector.
The market celebrated the latest Shoprite update (JSE: SHP)
The JSE’s best retailer closed more than 8% higher on the day
Shoprite has given the market an operational update for the 52 weeks to 28 June 2026. It’s not a detailed set of audited results yet, but there’s plenty of information here for the market to consider. With HEPS up by between 9.7% and 14.7%, Shoprite is doing extremely well.
The company is so big that they don’t just highlight their percentage growth; they also note the incremental rand value of sales. In order to grow sales from continuing operations by 7.2%, they needed to find an additional R18.1 billion to put through the tills. The sheer scale of this thing is extraordinary.
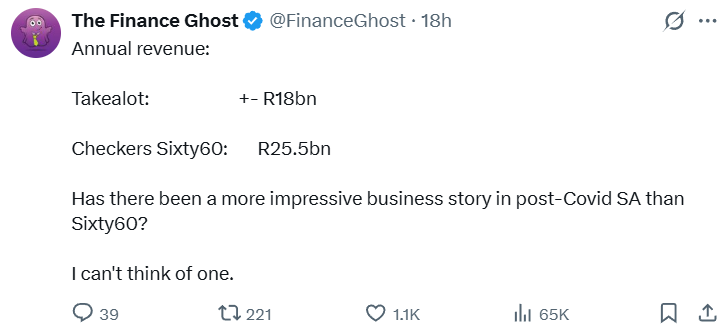
Speaking of scale, Sixty60’s revenue is now up to R25.5 billion (having just grown by 34.5%). It might actually be time for me to retire from serious company analysis and just post revenue numbers on X, if the response to this post is anything to go by:
Momentum throughout the year was incredibly consistent. They grew sales by 7.2% in the first half and 7.1% in the second half. The one area to highlight is Supermarkets Non-RSA, where growth was 12.1% in the first half and 10.0% in the second half. I’m not sure we can read too much into it, but that’s a slowdown in the African countries where Shoprite operates.
Supermarkets RSA is the biggest segment by a country mile (almost 85% of the group), so we will focus there.
Within that segment, like-for-like sales grew by 2.0% vs. internal selling price inflation of 0.8%, so Supermarkets RSA as a whole achieved volumes growth of roughly 1.2%. Note that selling price inflation is way below official inflation, showing how Shoprite can put pressure on its supplier to keep costs down.
There’s also a mix effect here. As we saw at lower-LSM competitor Boxer (JSE: BOX), there’s actually been food deflation in the Shoprite and Usave banners. As the proportion of staples in the basket increases, the level of deflation gets worse (or better, depending whether you’re thinking about it as the retailer or the consumer). Usave’s deflation was -0.6% vs. -0.1% at Shoprite. On a combined basis, the banners achieved growth of 4.3%, with Shoprite LiquorShop’s 10.6% growth as another notable number.
At the other end of the LSM spectrum, Checkers and Checkers Hyper grew 10.0%. Internal selling price inflation was 2.0% for Checkers and 1.2% for Checkers Hyper, so they’ve achieved significant gains in volumes here. Checkers Liquorshop sales were up by a substantial 14.5%!
Off a very small base, the “adjacent businesses” (like Petshop Science) grew by 57.3%. Just wait until you can buy from UNIQ and Little Me as part of your Sixty60 order. It’s clear to me that the group is building a logistics fulfilment layer that will service all the brands over time.
I also wonder about whether medicine will be part of this one day, with Medirite and Medirite Plus growing sales by 12.3%. Transpharm, the wholesale business, was up 7.8%. Sixty60 scooters carrying your pills, anyone?
It can’t all be good news of course. OK Franchise saw the termination of a franchise agreement covering a whopping 51 stores, so the footprint fell from 615 stores to 573 stores. In that context, it’s actually impressive that sales to OK franchise increased by 0.6%.
In case you’re wondering, the disposal of the South African furniture business to Pepkor (JSE: PPH) remains subject to approval by the Competition Tribunal. If you’re a Pepkor shareholder like me, you’ll hope it goes through. If you’re a Lewis (JSE: LEW) shareholder, you’ll certainly be hoping that it gets blocked!
Ghost Bite: Detailed results are due for release on 1 September. I have a timeslot with Pieter Engelbrecht that day, so let me know what questions you would like me to ask.
Nibbles:
Director dealings:
A director of Richemont (JSE: CFR) sold shares worth around R42 million. As this is a Swiss company, we don’t know which director it was.
The CEO of Salungano Group (JSE: SLG) bought shares in the company worth R2.5 million.
With results out in the wild, Des de Beer is back on the bid at Lighthouse Properties (JSE: LTE). He’s bought shares worth R401k.
The CEO of Spear REIT (JSE: SEA) bought shares for himself and his family worth around R170k.
Vodacom (JSE: VOD) announced that chairman Saki Macozoma will retire from the board at the AGM in July 2027. He would’ve been on the board for 10 years by that stage! The current lead independent director, Khumo Shuenyane, will be appointed as chair. As part of other board changes, Vodacom has also announcement the appointment of ex-Airtel Africa CEO Segun Ogunsanya to the board as an independent non-executive director.
Powerfleet (JSE: PWR) has terminated the employment of CFO David Wilson with immediate effect. He’s being replaced with Paul Lalljie. Wilson will receive a payment equal to 26 weeks of his salary, plus a pro-rated bonus. Oddly enough, the company has also entered into a consultancy relationship with the CFO that they just terminated!
Sebata Holdings (JSE: SEB) released a trading statement for the year ended March 2026. They expect HEPS to drop by between 94.1% and 95.4%! They attribute this to non-recurring items. I guess shareholders will find out for sure on 14 August.
Cilo Cybin (JSE: CCC) also released a trading statement for the year ended March 2026. The numbers look crazy because the group recognised a share-based payment expense of R217 million on the reverse acquisition of CC Pharmaceutical. There’s almost no trade in the stock as well. File this one under “companies that probably regret listing”.
The award-winning Investec Structured Products team brings you the latest iteration of International Titans Basket Ltd. This product offers 100% capital protection and geared upside (with a cap), referencing a basket of underlying global equity indices.
Bringing decades of experience and passion to this discussion, Japie Lubbe walks us through exactly how the structure works.
In this podcast:
00:00 Intro 01:32 60-40 portfolios vs. structured products 04:04 Track record of Investec Structured Products 05:00 Overview of latest product: International Titans Basket Limited 09:30 Index exposure and valuations 11:21 Stats around trying to “time” the market 13:41 100% capital protection 19:00 Backtesting the upside cap and gearing 21:02 The underlying mechanics of the structure 23:50 Credit risk 27:41 Fees and access to product
Watch on YouTube for the full experience
If you choose YouTube for this podcast, you benefit from the accompanying slides in the Investec presentation alongside Japie’s explanations:
You can find all the information you need on the Investec website at this link.
This podcast is for informational purposes only and does not constitute advice. You must speak to your independent financial advisor before investing in any product, and especially this one. Investec Corporate and Institutional Banking is a division of Investec Bank Ltd, an authorised financial services provider, a registered credit provider, an authorised over the counter derivatives provider and a member of the JSE. Ts and Cs apply to this product and you should refer to the Investec website for full details.
Transcript:
The Finance Ghost: Welcome to this episode of the Ghost Stories podcast. We come to you in August after a crazy month, actually, in the markets. We’ve seen all kinds of stuff going on out there.
I’m grateful to be able to lean on the experience today (and so much experience it is) of Japie Lubbe. He is the stalwart, really, of the multiple-award-winning Investec Structured Products team.
Japie, it’s always such a pleasure to do these with you. I really enjoy them. We are, of course, here to talk about one of your new products (as always), which is International Titans Basket Limited.
I think what’s going to be particularly interesting in this one (and for our listeners on Apple Podcasts and Spotify, don’t worry – it’s okay if you can’t see the slides), but if you’re watching this on my new YouTube channel, then we’ll be able to put up some of the slides from the presentation and that will just help with your understanding of this.
So, if you have access to YouTube, you may want to switch to that. But don’t worry, you can also carry on because Japie will take us through everything without you needing to have the slides.
Japie, welcome. Lovely to do another one of these with you and thank you for your time.
Japie Lubbe: Thank you!
The Finance Ghost: Let’s jump into a conversation about conventional wisdom. You’ve been around in the markets for long enough to know that conventional wisdom can change over time, and there’s been plenty of debate around that 60/40 split equities and bonds.
And it’s quite interesting because in the presentation for this particular product, you actually put a bit of effort into talking about this, to just set the scene in terms of how markets have actually behaved, whether this really still holds.
So, particularly with you on the podcast and with how many years you’ve been doing this for, Japie, I’d love to get some insight from you, first and foremost, on whether that conventional wisdom still holds and why that’s relevant to the structured products that you release into the market.
Japie Lubbe: Thank you. What we’ve done is we’ve had a look at market returns for different asset classes for the last 26 years. And in that period – this is now comparing the MSCI World (in dollars) in total return to bonds and cash and inflation. Very importantly, the 26-year average for equities, total return, was 7.1% per annum (p.a.). And the total return for bonds was 2.9% p.a., money market was 2.2% p.a. and inflation was 2.6% p.a.
What this means is that any portfolio that has 60% equities and 40% money market or bonds is going to have quite a difficulty outperforming inflation, because inflation has been higher – for a 26-year average – than money market, and has only been 0.3% below what bonds returned.
Now, I think that conventional wisdom probably worked very well in the years where interest rates were coming down, down, down all over the world. But of late, especially the period of 2021 to now, in the US, rates have kicked up a lot.
What that means is that the investors have taken a big haircut in their bond valuations and the equities have done well, but together, balanced funds have had very mediocre returns, if anywhere reasonable.
So our philosophy is that it’s probably better for the investor to allocate to equities, because they tend to have the stellar performance and ability to pass inflation through to the investor.
But some of the equities have it in a hedged way, like we’re going to be talking about today. Because then, if the equities have a very bad period, you just avoid the very bad period.
But in essence, over time, you’ve got more allocation to equities being the best asset class by some margin.
The Finance Ghost: Yeah, it’s certainly very interesting. I’m going to just touch on the track record here of the team: 23 years, 136 public products, 104 of which have matured. 100 have delivered positive returns, and the other four have returned capital to investors. Losses: none!
Japie, what a career. Well done. That is really, really impressive. Obviously that’s no losses on matured products, just to be clear, but still, a really good track record there.
And obviously all the caveats apply here about past performance and future performance and all the normal stuff, but I think it’s worth just mentioning that track record because that talks to what you’re saying at the moment, which is, well, consider equities in a structured way, as an alternative to the very traditional thinking around equities and bonds and everything else.
So, with that kind of track record behind you and people certainly paying attention to this, maybe give us just a broad overview of this new product, which is International Titans Basket Limited. I’ll give the floor to you to just walk us through what this thing is and what it does.
Japie Lubbe: Yeah, sure. So, this is now the fourth roll of this company. There’s a Guernsey company that’s listed in Bermuda, and the company’s term is five years. After five years, the investors decide whether they’re going to keep or sell their shares.
They do also have liquidity, which is because Investec makes a market in the shares during the five-year period. But this is now the fourth of these five-year periods.
For this one, the assets are going to be denominated in US dollars. It’s a five-year-and-one-month period, and the exposure – which is the engine to the vehicle – is an allocation of 35% S&P, 25% to the Euro Stoxx 50, 20% to the Nikkei 225, and 10% each to the FTSE 100 in the UK and emerging markets. That combination is 93% the same thing as the MSCI All-Country World Index. That’s the underlying market exposure.
The share comes with 100% capital protection if kept to maturity and on the basis that the banks pay, as you said have done in the last hundred that matured, there’s never been a bank or counterparty that’s not met their obligation.
And then the return will be whatever that portfolio of indices in those percentages do – with a gearing of 125%, or we refer to as a participation of 125% up to a cap of 40%.
So, keeping it simple, if the market does 20%, you get 20x 1.25. If the market does 40%, you get 40x 1.25, which would be 50%. And 50%, to put into perspective, equates to 8.3% p.a., as far as an internal rate of return – and that’s after all fees, costs and expenses.
And because that is achievable with no capital at risk, the first thing an investor should consider is how much is it worth to have equity exposure but with no capital at risk?
Well, that is simply like you take out insurance on your car or your medical aid. It’s called a put option. It’s the premium you pay to protect an asset. And in this context, for five years, world exposure to equities would cost you 12%.
These investors don’t need to incur that 12%, because you would appreciate if you had $100 and you had to pay away $12 to protect the $100, this means you’d only get 88% of the total return (like on an ETF, say). And dividend yields, with the markets being so hard down, they’re probably at 1.7%, 1.8%. So, five years of dividends couldn’t buy a protection on $100. It’s not sufficient.
So, the minimums here are $14,000. And this offering then is open until the 16th of October, then it closes.
The Finance Ghost: Very, very interesting. I know for sure that 100% capital protection is music to the ears of any investment audience, that’s for sure. And I just want to confirm there – that up to 8.3% p.a., that’s in US dollars.
Japie Lubbe: Yes.
The Finance Ghost: So, that needs to be thought of as a hard currency return, right? When you hear a percentage like that, you shouldn’t immediately think, “Oh, rand, what can I get at the bank?” You need to think, “US dollars.” Right? I just want to confirm that.
Japie Lubbe: Absolutely. And I think, to your point, what we’re seeing in the performance of the markets is that the MSCI World Total Return has done that 7.1% average for the 26 years. But the last period from September ’22 to now, it’s done 22.5% per year.
So, you’ve got to say to yourself, “If something performed for 26 years at 7.1% p.a. total return, but just the last three-and-a-half years, it’s done 22.5% p.a., that should be ample proof that it’s time to be cautious.”
And the caution should come from the fact that, firstly, the portfolios that have done very well – that’s fantastic. We’re very pleased about that.
But if I’m allocating money to the market now, or if I’m thinking, “How do I capitalise on where the market is?” – it might not be a bad idea to cash in some of the very highly valued shares, but keep the shares if they carry on doing well.
But in this case, you’re choosing the indices. Because, as we know, the indices from a passive perspective still pick up the shares that are doing very well. They dominate the index, and the ones that aren’t doing well fall out of the index.
But if the entire market corrects massively, like in 2008/2009, then you just get your 100 back in dollars. So, that’s very valuable in the context of a portfolio.
The Finance Ghost: Yeah, absolutely. It all comes down to risk/reward, right? I mean, that’s what investing is, and that’s certainly the way that these structured products are designed. So, let’s dig a little bit deeper into that equity exposure.
You’ve mentioned five indices there, and you’ve also mentioned the correlation to the MSCI All Country World Index (or the ACWI as I’ve heard it referred to).
Japie Lubbe: Yes.
The Finance Ghost: Now, those who might be worried about equities at the moment, and I think you’ve given us a good reason, there, to be worried, which is the incredible run they’ve had for the past few years versus long-term average. They do seem expensive, relative to historical averages.
I know that your presentation does go into some detail around average P/E ratio versus historical levels – again, if you’re on YouTube, you’re going to see some cool charts now. If you’re listening, just concentrate, because Japie will take you through it in a way where it’ll still make sense.
So, Japie, maybe just walk us through your view on, firstly, the concept of timing the market (biggest debate ever) and why that can be dangerous, because you can miss some key trading days, and also just some thoughts around the valuation levels at the moment and how you think about this world when you’re putting these products together and how you think investors should consider it.
Japie Lubbe: Yeah. So, firstly, coming to the valuations, at the moment, the MSCI World Total Return is trading at 23.5x.
So, 23-and-a-half years of earnings are required to qualify for the current value of that share. The long-term average is 18.9x. In statistical terms, this means it’s trading at around one to two standard deviations above the long-term average.
Obviously, an average is something that has been determined after mean reversion. After markets are over-expensive, they come back to the average. And if they’re too cheap one day, then they appreciate and they come back to the average. So, it is important to recognise that equity, as an asset class, has given 4.5% to 5.5% real return over the long term.
If your entry date is now and this thing is at the high end of the valuation, you just have to be mindful about the downside risk of that, or the risk that it actually just goes sideways.
Now, people may feel that, if it’s expensive, why don’t I just wait and then buy when it’s cheap? This is your point about trying to time the market.
We’ve done some research on that and, interestingly, if an investor was invested for the last 20 years every day and got the total return, like an ETF, and they didn’t have costs (in other words, they weren’t managing the money in any way, they were just buying the passive), a 20-year exposure invested every day would have given them an 8% p.a. dollar return.
But if they missed the best 10 days because they were trying to time it, and they so happened to not be in on the best 10 of the 20 years, that comes down to 4.7% from 8%. And if you miss the best 20 days, it comes to 2.5% from 8%. And if you miss the best 30 days, it comes to 0.8%.
So effectively, it’s extremely hard to time the market. That’s why that old saying goes, “It’s time in the market, it’s not trying to time the market,” because it’s very difficult for professional investors – anybody – to actually get that consistently right.
Another way to look at it is if you were to have put $100 into the market for the last 21 years once p.a. (if you put it into the money market, just kept it at the bank in the dollar money market), the $2,100 capital would have grown to $2,566.
But if you put it into the MSCI World All-Country like we’re talking about here, total return, and you picked the worst day every time for 21 years, you still would have gone to $5,723. If you were lucky enough to pick the best day, you would have gone to $7,714.
The point here is not to know when to pick the best or the worst, because you wouldn’t have known. But rather the gap between the $2,560 that the money-market-type yields would have given you, versus more than double and even treble that in equity exposure.
The Finance Ghost: Yeah, it’s fascinating, right? There’s a real message of hope there for all investors. Obviously the very important point here is that this is money put in every single year into the market.
So, dollar cost averaging is doing some wonders for you in this particular case, as opposed to taking your life savings and YOLOing them into memory stocks a couple of months ago. Probably not the kind of thing you want to be doing, but hopefully listeners to this podcast are not behaving like that – and if they are, they should be speaking to a financial advisor urgently for reasons beyond just this product.
Japie, the good news here, though, is that even if things go really badly (and I’ll just refer back to the track record here where that’s only happened, what was it – I think four times out of 104?), you’ve merely returned capital. But it can happen, and there’s absolutely a chance. That’s where the 100% capital protection makes a lot of sense.
I know that this is something that investors really do like, so perhaps you can just walk us through the example that you give in the slide pack around the impact it actually has when you’ve got that capital protection at maturity, and just how much better off you are than someone who doesn’t necessarily benefit from that.
Japie Lubbe: Absolutely. Because most people are saving, let’s say for when they’re old one day or for their children or their grandchildren, for a legacy. So, you’ve got to think long-term when you’re investing your money – especially in equities, because equities you’ve got to give time, firstly, that’s why we like five years (unless you’re a day trader, but that’s not what this discussion is about).
Now we’ve got this example where this is actually one of those four where we returned the capital. The specific company was called the Euro Asian. It was done, you know, 17 years ago, and effectively, it had two underlying indices: 50/50, half the Euro Stoxx 50 and half the Nikkei 225, okay? Half each.
If you calibrated those two indices to the year 2000 and you started at 100, by the time 2002 came and you’d been through the dot-com bust, it would have been down to 50 (the 100). It then went back up to 100 when we started our company, which was a five-and-a-half year tenure and our investors went in at 100. Five-and-a-half years later those two indices were at 56. From 100 they’d gone back down to 56.
Our investors, because they had 100% capital protection, got out their 100, so they didn’t lose the 44.
And you see what happens in maths is we think of it as a 44 loss. What you should think of is the 44 on 56, where it is now, means it’s got to go up 85 to get back to where you were. Okay? You must look at the maths from where you are to where you needed to get back to where you’d originally been.
Now if the investors stayed with those two indices, which were then worth 56, they would have potentially been quite happy, because it has grown back to 252. We know how the Nikkei and the Euro Stoxx have gone up. Your traditional investor would have been quite happy thinking, “My 56 has grown back to 252, like in a unit trust or an ETF.”
Now what we demonstrate here to our actual investors (this is not a theory) is that by staying 50/50, they’re now at 468 versus 252 – same underlying indices, no change in the underlying indices, but just starting the date at 100 and not at 56.
So, this is actually really important because what it means in a portfolio when you’ve got different assets – we would never recommend what we’re talking about today for all the money, maybe 20%, 25% of clients’ money – but that portion has a huge advantage if there is ever a big correction.
And if you look at the 200-year track record of equities, you’ll see it’s just, “When does it come?” Assets tend to overextend themselves and get to too high a valuation and then, you know, there’s a mark of time why they come down or stay sideways.
So, this is the value of the 100% protection. It’s the fact that downstream, the investor at the maturity, if it was bad, is getting into the market at the spot level of the market in future, but with 100 in their hand and the market’s price at 56.
Ordinarily, your problem is your statement tells you you’re worth 56. And you can’t say, “I wish I wasn’t invested.” You are. And, unfortunately, you now have to wait until, one day, you get back to where you’d been or make money – and you can never catch up.
It’s the same concept as why people on this podcast, I’m sure, all take out medical aid, life insurance, car insurance, household insurance. If you do not take out medical aid, and you might be young and fit and strong, but if you get very badly ill and you don’t have medical aid, you can never recover in life.
Same as your car. You drive your car, you don’t have insurance, you drive into a Ferrari and you’re going to pay. You’ve to sell your assets, you’ve got to sell your house, to pay. The guy’s got insurance, he just phones Santam or OUTsurance, whoever, and says, “You guys pay for this car.”
And now in investments, it’s also important to have a portion of your investments protected, in case (Heaven forbid), bad times come.
The Finance Ghost: Yeah, I love that. It’s a bit like you’re getting ready to run a 100-meter race, you know? And if you’ve got the capital protection, you’re on the starting blocks, you’re ready to go again. And if you didn’t have the capital protection, you’re still tying your shoelaces when the gun goes off and you can work out for yourself who’s going to finish that race a lot better.
So, it is a very powerful concept. And again, it’s managing the downside risk. You’ve got to give up some of the upside potentially. There’s no way of knowing for sure what the markets will do over the next few years. You might not be giving up anything – in fact, you might be better off because of the gearing – but there is a cap on the upside, and that’s the important thing that you might be giving away in order to get the 100% downside protection, right?
Like everything in life, it’s a bit of yin and yang. You’ve got to give away and get some stuff on the other side. So, let’s talk about that, because that’s the participation of 125% with the index basket growth capped at 40%. In other words, you can get up to 50% total.
And, as you gave us earlier over the period that works out to a compound annual growth rate of just over 8%. And you’ve obviously backtested this. So, I think (again, a really interesting chart for those listening on YouTube – there’s the payoff simulation in the presentation by Investec, and maybe we’ll put that up for this discussion), Japie, perhaps you can just walk us through the way you think about these payoffs and how you actually backtest this?
Japie Lubbe: So, firstly we did a backtest on if you had had such a share that paid off between 0 and 50 in the past compared to having had these indices at those weightings on a five-year rolling return. Because in the case of this simulated share, you didn’t take losses – and losses happened (this is from 1988 to now) 22% of the time – because you had the geared upside up to 50% and no losses, you would have actually outperformed the physical exposure 54% of the time.
That means that at world-level (so we’re not talking single shares here, we’re talking at world equity as an asset class), the cap we put at 40% is because we look at the history, even the most recent 26 years, 7.1% p.a. total return for five years compounds to 40%.
That’s why we’re comfortable to say put a cap at 40% because if you’ve just had three-and-a-half years at 22.5%, the likelihood of it outperforming the average is probably quite limited. There’s more likelihood that you actually have a correction, or that it goes sideways.
But I think another important thing just to add here for the listeners is, in this structure (which you don’t get in normal shares, ETFs and unit trusts), after five years, if it’s been positive, like we’ve got an example of one of our other shares in the pack where after five years you lock in the performance. In other words, if it’s been positive, your $100 now goes to $150 and that becomes the capital protection for the next five years.
But simply because the investor owns a share in a company, they haven’t sold their shares and you only pay tax one day when you sell the shares in the company. And at that time you only pay tax on the profit in the foreign currency. These are all foreign shares. They’re not rand-denominated shares. That’s important.
So, if we go to the actual makeup of, “How does such a share work?” – in other words, so that the listeners can understand, “How is it that Investec is going to offer them this thing?” – we have an example whereby on day one of the new phase, we’ll have $100. So, $100 will be the total capital, and we take $74 of that and we’re going to give that to Investec on a dollar-denominated credit link note. We’ll talk about that a bit more in due course.
That $74 will grow to $75, $76 and mature in five years’ time at $100. This is inside this Guernsey company. And that’s just a formula according to a contract we signed with Investec, that’s what protects the capital. So, that’s got nothing to do with shares. It’s a bond, okay? It’s a fixed income instrument inside the company.
Then we put aside, for five years of fees costs, expenses, auditors, lawyers – all the costs for the five years – that’s $7 and that amortises down to $6, $5, $4, $3, $2, $1, $0.
So, at the end of five years, that money has been paid out, but as part of the $100; included in the $100. That means, on day one, you’ve got $19 left over.
What we do is we go to the banks and we say, “What would a call option cost?” A call option is an asset that gives you, one-for-one, whatever the market’s doing, unlimited, okay? One-for-one. So, if the market does $10, they pay you out $10. And the premium you’ve got to pay on that now is $20.
Because we’ve only got $19, what we do is we say to the bank, the counterparty bank (and we’ve got eight of them competing for the trade), “What would you pay us? What would you rebate us, if we sold your call option at $140, at a level of $140?”
They say, “Okay, well then we’ll rebate you $4.8 for that because you stop participating if it goes above 40%.” Hence the $20 less the $4.8 is $15.2. And you simply take the $19 you have available and you divide it by $15.2. That’s how you get the 1.25 or the 125% gearing.
So, in five years’ time, if the stock exchange has gone down $40, the options are worthless. They’re call options. They only pay if they go up and the fees and costs have been amortised. But the $74 still grew to $100. So, that’s how you then have the $100 to reimburse the investor.
And as I said, then the stock exchange is now priced at $60. Very good time to come into it.
If the market’s gone up, whatever it’s gone up by, you take that percentage and you times it by 1.25 until you hit 40%. And at 40% you then made the $50.
So, it’s very simple, you know – obviously from where we’re sitting. But for a normal investor, if you said to me, “Can I do this myself?” It’s very, very difficult, because you can’t buy the same assets at the same pricing because this transaction is probably going to go out at $150 or $200 million. They’re a very big company.
So, that’s how we actually construct the company to give the payoff we’re saying to the investor.
Maybe the most important thing to consider here is: whose obligation is it to pay? In other words, “Who am I reliant on here, as an investor?” We refer to that as the credit risk, the risk on the options.
In other words, the guys who sell us the call option structure can only be a bank with an S&P A or better rating. So, you’re talking JP Morgan, UBS, the biggest banks – and we get eight to ten of them to compete for the transaction, because our Guernsey company can place the assets with any one of them; we haven’t pre-selected.
On the debt, that’s $74, which grows to $100. What we do is we’re going to buy that from Investec. So, senior debt of Investec, and we agree with Investec that they can take one fifth each. So, five names of international banks that are investment grade i.e. much higher rated than SA government debt), and one fifth each to the tier 2 debt, the debt that’s subordinate to the depositor.
Now, the question arises, “How do I, as a man in the street or a lay person, how do I know? What must I look at before I put my money with any bank in the world? What are the things that I must rely on to make sure that I’m going to be fine?”
Obviously, Investec is doing this for the investors. We’ve got the track record, as you’ve said, but essentially, the banks we can use (because we haven’t pre-selected, again – we want to use the best on the day) are Commerzbank, Deutsche Bank, Barclays, UBS, ING, Royal Bank of Canada, Lloyds, NatWest. These are massive, systemic banks of those countries.
And the three things you look at are, firstly, the dividend yield, the ordinary share dividend yield. And if you look at the material, you’ll see that these banks have all been paying ordinary dividends for the last 10 years.
Now, under the strict regulation that exists in the world, banks can’t pay dividends if they’ve got any question about their capital or their solvency or their liquidity or stress testing, you know – anything that the reserve bank checks, they check it quarterly.
So, banks are highly regulated. They’ve got to provide all the numbers. And if there are any questions about any aspect, firstly the regulator says, “Get your shareholders, put more capital in.” And also, they don’t enable them to pay ordinary dividends. So, that’s the first thing.
The second thing where an investor can see how solid a bank is, is what we refer to as the ‘credit spreads’. The credit spread is the amount of interest rate that you pay above the curve to get money from the market.
And as we speak, credit spreads in the world (these banks, inclusive) are at, like, 26-year lows. So, banks have viewed the best that they’ve been in the market by capital markets, hedge funds, etcetera, because of this very strict set of rules, and regulation, and control, which happened after the GFC (Global Financial Crisis).
There were problems (you remember Lehman Brothers). Consequently, they’ve tightened the noose and they’re really, really strict on them.
And the last thing is the share prices – what has happened to the prices of the actual ordinary shares. We’ve just done an input which shows that if you started at 100 five years ago, all the banks we could potentially take exposure to here are at 200-plus starting at 100. So, they all doubled in price.
Really, all that’s saying to us is that, with quite big moves in interest rates, up, down, as you know, the banks are sitting very solid, because banks are recognising that they’re highly regulated. The reserve banks push them to make sure that they look after their affairs very well.
But, as you said, we don’t know what the future holds. But what we do know is, as Investec, doing this job, we’ve done this for 25 years. We obviously want to maintain our record – and we invest our own monies in these – so we’ll do our best to ensure that this is as solid as possible.
And also, the investors have liquidity. So, let’s say I buy the shares and, one day, I don’t like one of the banks that was included. I sell my shares; I’m not compelled to hold the shares for the full five years.
The Finance Ghost: Japie, thanks. Always good to understand the way you actually think through all of this; how you think about these banks, who the counterparties are, and everything else. We learn so much from doing these podcasts with you.
And obviously, from an investor and potential investor perspective, people want to know about fees. That’s always a big talking point. So, let’s deal with that quickly and then I’m going to ask you to, straight after that, just deal with how people actually go about investing – what are the minimums; who do they contact?
So, fees and access, and then we can bring this one to a close. Thank you.
Japie Lubbe: Yeah, thanks. So, as we showed, we put aside (upfront on day one), roughly 7% for five years of fees and costs and expenses. Now, what the investors appreciate is they’re getting 100% capital protection from the Investec bond, but they don’t have to buy – like you have to buy yourself car insurance, medical aid – and pay a premium.
If you had to do that yourself, it would cost you 12%. If you, today, phoned a bank and said, “I want to protect my $100 on the MSCI World for five years,” – this is not a problem, send me a cheque of $12. We only need $7.
So, firstly, it’s a whole lot less than the vanilla alternative in the market, which is to buy your own insurance.
Secondly, how that $7 works is we have distributors – people who sell this and give advice to the investors as to how much to put in; all the normal advice – they earn 0.6% p.a. We, as Investec Capital Markets (who structure it), and/or the promoters, we earn 0.6%.
And then, we have the administrators. They offer the directors for the company and do all the share administration (because the company is highly regulated – it’s regulated under the Guernsey Financial Services Commission; it’s regulated in Bermuda as a listed share with Grant Thornton as the auditors; it’s regulated in South Africa under the Companies Act and registered prospectuses – all of that’s highly regulated). The important thing is they earn 0.11% p.a.
And then there’s a once-off charge for the auditors and the lawyers, and that’s about 0.5%. But all told, together, it’s roughly $7.
As I said, investors aren’t baulking at that because the alternative is to pay $12, and here you’re only paying $7. It’s built into the $100 that you gave.
So, importantly, if markets are bad (let’s say they go down 40%), you don’t have a 40% market loss plus five years of fees. You get your $100 back, which means that the $7 was already provided for. That’s very beneficial, from a cost perspective.
Also, if you think about it, you could buy unit trusts. Most international share unit trusts, equity unit trusts, probably cost you 1.7% to 2%, depending which one you take, but there’s no protection.
In other words, if it goes down 40%, you’re going to be down 40%, roughly – maybe 38% or maybe 42%, but roughly 40%. So, there’s a big distinction. That’s the protective aspect.
One other thing I’d just like to mention is that we started the conversation by saying we’ve done this for a long time. We gave the long-term track record of our team. This particular type of company, we’ve done. This is the 30th one.
We’ve had 24 of these that have matured. Of the 24, we gave a profit. We beat the underlying index. 23 of the 24 – that’s 96%.
We had a look on Morningstar (which is the information base that you can check all the unit trusts in the world) and the unit trusts trying to beat MSCI World – which is the biggest universe – over five years, 30% could beat it. Over 10 years, 33%.
Then we had a look. Why is it that we beat these indices over that period by so much? And 30% of our outperformance came from not losing money. Not losing money is actually very, very valuable if you look at the composite impact of that on your total.
Lastly, we outperformed those indices by an average of 2.49% p.a. in hard currency for five years across 24 companies, and the dividend yields on those markets was 2.38%.
In summary, this way of managing money… you’re taking the risk on the banks, because of the credit risk, as we discussed, but the consequence has been that we’ve beaten the total return (now, the total return is the market plus the dividends), and we’ve applied no fees to the total return. We said, “Let’s say you get it for free – you can’t get it cheaper.”
At this point, beating those markets, compared to the unit trust industry (again, it’s not unit trust A or B, it’s just the market), we found that 9.2% of unit trust managers could beat the total return, over 10 years. And this product range, over 23 years, has beaten it.
And as I said, a big part of that is the construct. It’s the way it’s put together, and it’s the fact that the investors are happy to take on Investec risk or JP Morgan or the banks that promise to pay. Because those banks – being so highly regulated – it’s very hard for them not to pay, but it could happen that they don’t. Then you’d need a recovery rate on your debt.
Your applications here have to be for at least $14,000. What we would recommend, if anybody’s interested, is that you just contact us.
We’ll discuss with the investor or potential investor, whether they have an advisor (because we have many, many advisors that have got licences with us to market and sell the product), or whether they use an online platform, (like DMA), or they’re clients of Investec. Depending on the circumstance, we’ll put them onto the easiest route.
Also, if they need advice, the important thing is: we’re not giving advice here. This is just a product which says what the product does.
But the customer may feel, “I’m not sure how much would be appropriate for me or whether this would in any way be appropriate.” Then we could put them onto an advisor. That would be the easiest way to assist.
It closes on the 16th of October, so there’s plenty of time. But what we’ve seen with all these things is there’s administration – you sometimes have to apply to get your money offshore. It’s a foreign share; it’s not a local rand share – and, consequently, following that up in good time is good advice.
The Finance Ghost: Japie, thank you. Always such an absolute pleasure. I think this gives everyone a huge amount of information to work through. And if you’re interested, please do follow the advice there – contact the team or speak to your financial advisor. There are multiple ways to get into this.
Japie, good luck with this raise. I’m sure it’ll be a success, as it always is. Your track record speaks for itself. Thank you for coming back to the Ghost Mail audience.
I’m particularly stoked to be able to put one on YouTube for the first time with these supporting slides, so that listeners can actually go and check out the presentation as you would be delivering it to any of your big clients. I love the fact that we have this kind of access now in Ghost Mail.
Thank you, Japie, for your time today, and all the best with this.
Japie Lubbe: Thank you.
This podcast is for informational purposes only and does not constitute advice. You must speak to your independent financial advisor before investing in any product, and especially this one. Investec Corporate and Institutional Banking is a division of Investec Bank Ltd, an authorised financial services provider, a registered credit provider, an authorised over the counter derivatives provider and a member of the JSE. Ts and Cs apply to this product and you should refer to the Investec website for full details.
We use cookies on our website to give you the most relevant experience by remembering your preferences and repeat visits. By clicking “Accept All”, you consent to the use of ALL the cookies. However, you may visit "Cookie Settings" to provide a controlled consent.
This website uses cookies to improve your experience while you navigate through the website. Out of these, the cookies that are categorized as necessary are stored on your browser as they are essential for the working of basic functionalities of the website. We also use third-party cookies that help us analyze and understand how you use this website. These cookies will be stored in your browser only with your consent. You also have the option to opt-out of these cookies. But opting out of some of these cookies may affect your browsing experience.
Necessary cookies are absolutely essential for the website to function properly. These cookies ensure basic functionalities and security features of the website, anonymously.
Cookie
Duration
Description
cookielawinfo-checkbox-analytics
11 months
This cookie is set by GDPR Cookie Consent plugin. The cookie is used to store the user consent for the cookies in the category "Analytics".
cookielawinfo-checkbox-functional
11 months
The cookie is set by GDPR cookie consent to record the user consent for the cookies in the category "Functional".
cookielawinfo-checkbox-necessary
11 months
This cookie is set by GDPR Cookie Consent plugin. The cookies is used to store the user consent for the cookies in the category "Necessary".
cookielawinfo-checkbox-others
11 months
This cookie is set by GDPR Cookie Consent plugin. The cookie is used to store the user consent for the cookies in the category "Other.
cookielawinfo-checkbox-performance
11 months
This cookie is set by GDPR Cookie Consent plugin. The cookie is used to store the user consent for the cookies in the category "Performance".
viewed_cookie_policy
11 months
The cookie is set by the GDPR Cookie Consent plugin and is used to store whether or not user has consented to the use of cookies. It does not store any personal data.
Functional cookies help to perform certain functionalities like sharing the content of the website on social media platforms, collect feedbacks, and other third-party features.
Performance cookies are used to understand and analyze the key performance indexes of the website which helps in delivering a better user experience for the visitors.
Analytical cookies are used to understand how visitors interact with the website. These cookies help provide information on metrics the number of visitors, bounce rate, traffic source, etc.
Advertisement cookies are used to provide visitors with relevant ads and marketing campaigns. These cookies track visitors across websites and collect information to provide customized ads.