
Bidcorp has increased margins in a relatively subdued environment (JSE: BID)
This is one of the best examples of a South African company achieving global success
The JSE is littered with the broken hearts and dreams of corporates who rolled the dice on international acquisitions and destroyed shareholder value in the process. But Bidcorp stands head and shoulders above the crowd, with a track record of organic and inorganic growth on the global stage. They even manage to make money in that most treacherous market of all: Australia! If you want to see a great example of a South African company finding success abroad, Bidcorp is a good place to look.
The company has given an update for the four months to October 2025. Revenue growth was 8% and trading profit growth was 8.6%, so they’ve managed to improve margins despite a difficult global operating environment. HEPS is up by 7.2% for the four months. The margin performance is made all the more impressive by a tricky inflation environment in which operating costs (like labour) are more inflationary than food prices.
Importantly, acquisitions contributed 1.4% growth in net revenue and product inflation was 2.0%. Like-for-like real organic growth (which I think is their way of saying “volumes”) was up 4%. The combination of bolt-on acquisitions and organic growth is a core feature of Bidcorp’s model, with four acquisitions year-to-date.
The constant currency numbers aren’t quite as good as the rand results noted above. The group has a mix of international businesses and they don’t operate in the US, so the rand strength against the US dollar actually doesn’t apply here. Instead, the rand’s relative weakness against a basket of other currencies has boosted the numbers.
If we look at the regional performance, Australasia grew trading profit slightly thanks to sales growth of 5%, with better momentum in margins towards the end of the period. In Europe, sales were up 9% in constant currency, but the company hasn’t indicated how margins behaved. The UK was up 5% in constant currency and trading profit growth was more than 8%, so they are doing well there in a market that has lost some of its shine. The emerging markets business has delivered year-to-date sales and trading profit growth of 7% in constant currencies.

Dipula Properties boosted by its retail portfolio (JSE: DIB)
A drop in funding costs also helped greatly
Dipula Properties released results for the year ended August. They grew net property income by 3% and distributable earnings per share by 5%. The net asset value (NAV) per share increased by 7.5%. Overall, that’s a decent set of numbers that has rewarded shareholders looking for growth in excess of inflation.
The dip in interest rates was particularly helpful here, with a 20 basis points reduction in the weighted average cost of debt for the group. This is why distributable earnings per share growth was higher than underlying property income growth.
From a NAV perspective, it was the retail portfolio that did the heavy lifting with a 10.1% uplift on a like-for-like basis. It contributes just over two-thirds of the portfolio at Dipula. Office dipped by 0.7% despite the discount rate actually dropping, so things are still tough in that part of the market. Dipula’s recent acquisition strategy reflects a strong bias for retail assets (as it should), as well as industrial plays.
The loan-to-value ratio improved from 35.7% to 34.9% over the past year. This doesn’t take into account the R559 million in equity raised in early September.
The fund has guided distributable earnings growth of 7% in 2026. Given the capital raising and acquisitive activity, one must be careful in assuming that the per-share increase will be similar.
Emira Property’s growth was hampered by the US exposure (JSE: EMI)
But at least they are in the green
Emira Property Fund released results for the six months to September. They aren’t great compared to most other property funds, with distributable income per share up by only 1.2%. The dividend per share has increased by 3.2%. Things are growing, but not by much. The NAV per share was only up by 1.4%, in line with the rather tepid performance seen in the other important numbers.
Emira is a rare breed on the JSE, as the fund includes material exposure to the US market (14% of the portfolio). Poland comprises 23% and the remaining 63% is in South Africa. Normally, the US exposure would be a lovely rand hedge. In recent times though, the rand has strengthened against the US dollar. When you combine this with the disposal of certain assets in the US, you end up with a significant decrease in earnings from that investment.
An interesting insight from the segmental view is that office vacancies improved to 8% from 8.4%. Although there is still oversupply in the market, Emira’s P- and A-grade portfolio is the best kind of office portfolio. The lower grade stuff in the market has been horrific.
As a reminder, Emira acquired shares in SA Corporate Real Estate (JSE: SAC) during and after the reporting period. They currently have an interest of 8.7% in the fund.
Gold Fields estimates operating cash flow of $20 billion over the next 5 years (JSE: GFI)
Sustaining capital and the base dividend will be similar in size
Gold Fields held a capital markets day on Wednesday. The presentation goes into much detail on the journey taken by the company over the years and what the mines look like today.
It also includes their base case financial plan for the next 5 years. This obviously depends greatly on gold prices, so you can’t treat this as much more than a best guess. The useful thing about it is it shows how the group is thinking about capital allocation:
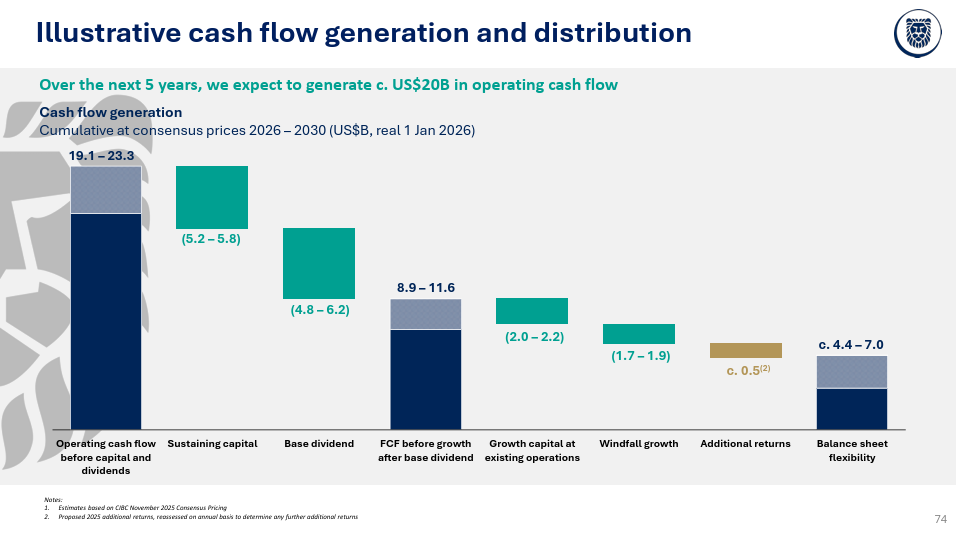
As you can see, they are forecasting roughly $20 billion in cumulative operating cash flow from 2026 to 2030. They need to spend over $5 billion on sustaining capital, with the plan being to pay a fairly similar amount in base dividends. This leaves them with roughly half of the starting amount for use in capital projects and whatever else comes up along the way, like acquisitions or perhaps share buybacks and special dividends.
The thing with forecasts is that the numbers will almost certainly be wrong, but the underlying direction of travel and thinking along the way won’t be far off.
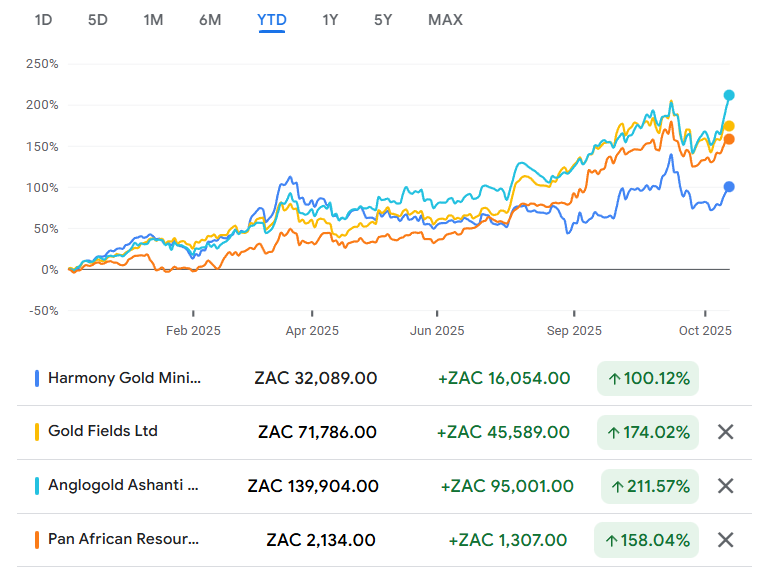
The gold price is doing all the work at Harmony Gold (JSE: HAR)
For various reasons, production is lower at exactly the wrong time
With the gold price shining brightly at the moment, gold miners are being measured on their ability to maximise production to respond to the opportunity. Some are doing precisely that, while others are suffering a drop in production based on various factors.
Harmony Gold finds itself in the latter category, with group production down by 8% for the first quarter of the financial year. This might be “planned” and “guided” but it’s still irritating for shareholders, as it means that the 34% increase in the average gold price translated into an increase in revenue of only 20%. The production pressure means that all-in sustaining costs (AISC) per kilogram increased by 15%. Cash operating costs per kilogram were up 14%. The profit performance clearly isn’t anywhere near as juicy as numbers we’ve seen elsewhere in the sector, like at AngloGold Ashanti (JSE: ANG) in the past week.
At a time when gold is doing so well, Harmony is allocating capital into copper as a source of diversification. The acquisition of MAC Copper was concluded in October.
Harmony has done well when viewed in isolation, but has severely underperformed its peers this year:
Growth – finally! – at PBT Holdings (JSE: PBT)
Is the painful sideways journey behind them?
PBT Group, at its core, is a management consulting company that experienced rapid growth during the pandemic. Companies needed help with their digital journeys and their data strategies, creating an excellent opportunity for this company (and global names like Accenture) to bulk up their teams and respond to demand.
But in the aftermath of the pandemic, it’s been hard to grow off that base. PBT has a solid market positioning in South Africa and an appealing spread of clients, so they were at least able to consolidate and navigate a sideways period.
It’s great to see that growth is back, albeit only modestly at revenue level (up by between 3% and 4% for the six months to September 2025). But here’s the kicker: the group has taken the necessary steps to become more efficient, driving an increase in HEPS of between 20% and 23.5%! Normalised HEPS is more modest at a range of 13.1% to 16.0%, but that’s still better than I think anyone was expecting.
Cash from operations is up by between 6.6% and 9.5%, so that will be worth digging into when full results become available on 28 November.
Purple Group is loving every minute of the J-curve (JSE: PPE)
I remain very happily long here
It’s always lovely seeing a platform business flourish up the J-curve. It’s like watching a flower blossom in the garden after putting work into the soil and remembering to water it. Purple Group is doing more than just blossom, with results for the year ended August reflecting revenue growth of 21.5% and HEPS growth of a whopping 143.3%!
This is the thing in a business like this: once all the infrastructure has been laid down, the incremental growth is highly profitable.
Importantly, the group continues to enjoy various growth flywheels. The number of active clients was up 15.7%, yet retail inflows increased by 48.2% as the group enjoyed the benefit of a client base built up over many years. The introduction of a recurring revenue model in the aftermath of the pandemic has also done wonders for the economics of the business.
I think this chart does a solid job of showing the growth not just in the core EasyEquities Retail business, but also the revenue streams that have been layered on top:
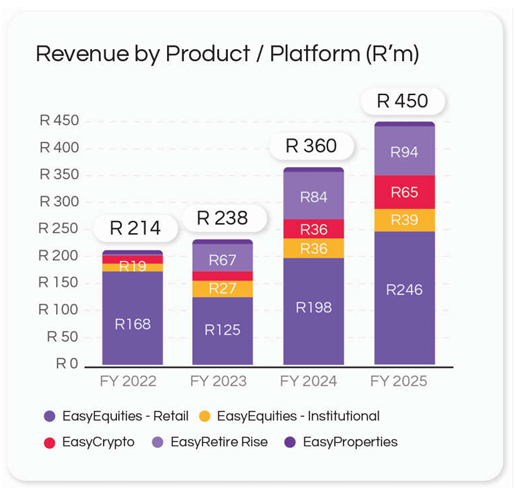
With an excellent foundation having been built in EasyEquities and the associated businesses, the future is all about how to take more financial products to that client base. There are so many options here, ranging from mortgages to crypto. There’s also the opportunity to take users up the curve in terms of sophistication and trade activity, with EasyTrader appealing to those who are looking for more than just the basic buy-and-hold platform.
The momentum in the business looks very strong, with record deposits in October. The share price might reflect a P/E multiple of 51.6x, but that could unwind quickly if they keep growing profits at this rate. My view is that there’s more than enough to believe in here, so I think the share price was justified in doubling year-to-date.
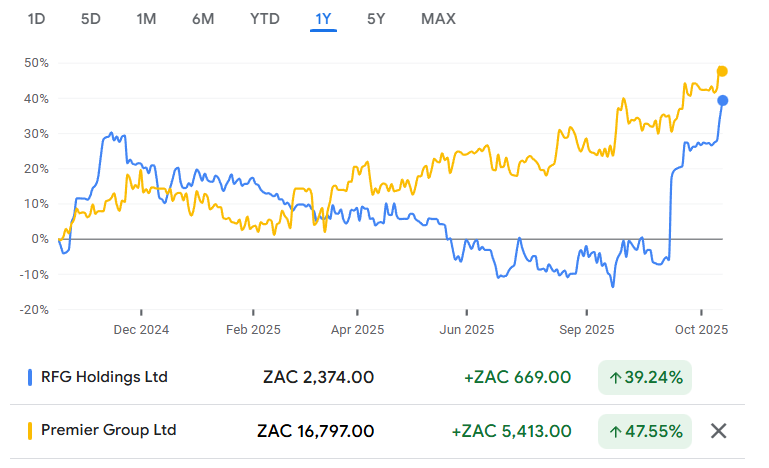
RFG Holdings suffers an earnings drop (JSE: RFG)
This comes after excellent numbers were released by Premier (JSE: PMR), the potential acquirer of the group
RFG Holdings has released a trading statement for the year ended September that shows just how much volatility they are having to deal with across their business. It makes for fascinating reading in the same week that Premier released such solid numbers. I’m still not sure why Premier wants to make its business riskier by taking on more discretionary categories like the ones you’ll find at RFG Holdings.
The food sector has many global examples of mergers and deals that should never have happened. In fact, Tiger Brands (JSE: TBS) is doing well at the moment because they are essentially unscrambling the egg by selling off things they should never have owned!
Anyway, we move on to the earnings guidance at RFG Holdings for the year. They expect HEPS to be between 8% and 13% lower, so that’s a disappointing outcome. The first negative factor is weakness in canned meat volumes, driven by inflationary pressures on the cost of the products and constrained demand. The second factor is lower demand in the international segment thanks to a global oversupply of deciduous fruit products and thus a dip in gross margins. And once you add in the effect of a stronger rand, the global numbers look even worse.
Like I said when I wrote about Premier earlier in the week, it feels like RFG Holdings is a structurally riskier business that will have more volatile earnings and thus a lower valuation multiple applied to those earnings. As the share price showed, Premier was doing far better than RFG before news of the deal sent the RFG share price much higher:
RMB Holdings has impaired the stake in Atterbury (JSE: RMH)
Like all impairments, this is related to the recoverable amount of the investment
RMB Holdings is one of several examples of a value unlock strategy being followed by a JSE-listed investment holding company. The thesis is usually along these lines: sell off all the assets in the group and return the capital to shareholders. The market usually responds like this: “Great, but until we see those assets turn into cash, you’re trading at a fat discount to net asset value (NAV) per share.”
And in practice, what tends to happen is that the easy assets get sold first and there’s good progress in returning capital to shareholders. But when it gets to the long tail of assets that are either poor performers or difficult to sell for some reason, then the wheels fall off.
At RMB Holdings, their stake in Atterbury is a difficult thing to sell based on its size and the shape of that shareholder register. It seems that this reality has found its way onto the balance sheet, with an impairment to the stake leading to an expected drop in the NAV for the year ended September 2025 of between 20% and 36%. This actually ties in with the typical marketability discounts that we’ve seen when investment holding companies are taken private.
The NAV range is 42.3 cents to 52.7 cents. The share price was trading at 45 cents before the announcement and subsequently fell to 40 cents.
Stefanutti Stocks flags a juicy jump in earnings (JSE: SSK)
The construction group has made a lot of progress
Stefanutti Stocks has had quite the journey in recent years. Just take a look at this share price chart:
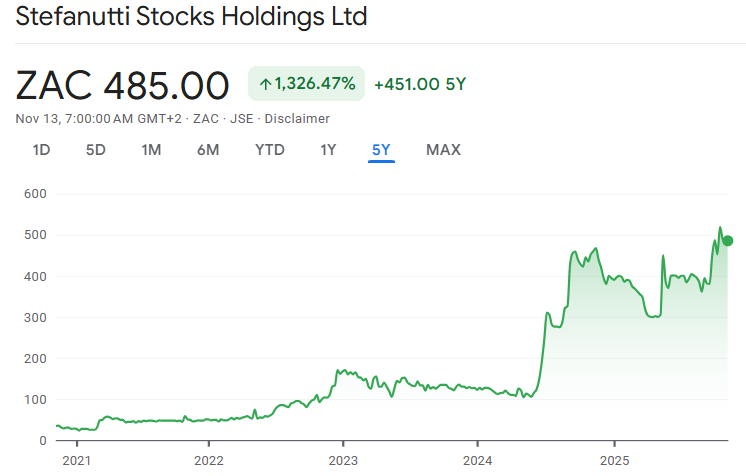
When looking at the trading statement for the six months to August, you need to keep in mind that SS-Construções (Moçambique) Limitada and Stefanutti Stocks
Construction Limited are held for sale. This means that there’s a big difference between earnings from total operations and earnings from continuing operations.
Continuing operations are what count. As the name suggests, these are the operations that shareholders are left with once the other deals close. HEPS from continuing operations will increase by between 45% and 65%. In case you’re wondering though, HEPS from total operations is up by between 150% and 170%.
Detailed results are expected to be made available on 25 November.
Woolworths paints a much better picture for their South African business (JSE: WHL)
Australia is still cause for concern
The apparel sector in South Africa just keeps dishing up fascinating announcements. The latest example is from Woolworths, a group that has a special place deep in the hearts of high income South African households – well, that’s true for the Woolworths Food business at least.
Fashion, Beauty and Home (FBH) has had a much tougher time of things, with only a few bright spots in areas like beauty. But for the first time in a long time, the performances across Food and FBH are of similar quality. I’m afraid that this makes things even worse for sentiment towards sector laggards Truworths (JSE: TRU) and The Foschini Group (JSE: TFG).
The Woolies update covers the 19 weeks to 9 November. As you compare it to other recent updates, just be aware of differences in trading periods and thus base periods as well.
Woolworths South Africa achieved sales growth of 7.4% for the period, with Food up 7.7% and FBH up 6.2%. If we look at comparable store growth, Food was up 6.0% and FBH managed 6.6%. The reason why FBH’s comparable store growth is higher than total growth is because they’ve been reducing trading space as part of becoming a more focused and stronger business.
Price movement at Woolworths Food was 4.8%, so even the organic what-whats that they sell aren’t experiencing runaway prices at the moment. Customers are also enjoying the convenience of Woolies Dash, with sales up 24.2%. Online is now 7.3% of SA Food sales.
At FBH, price movement was 3.3%. This means they achieved growth in volumes in the business, including in fashion where the trouble has been. The fashion business is still not the growth engine, as that recognition must go to beauty (up 9.6%) and home (up 13.8%). In case you’re wondering, online sales contribute 6% of FBH sales.
Sales were supported by a cautious approach to credit, with the Woolworths Financial Services book up 1.5% on an adjusted basis. The impairment rate is described as being sector leading, so that speaks to the caution as well.
We now reach the ongoing headache: Country Road Group. There’s a note around a “gradual improvement” in that market, with sales up 3.3% overall and 3.9% on a comparable store basis. They talk about net trading space being similar, so I’m not sure what is driving the significant difference between those two growth percentages. My worry is that they talk about the sector being “challenging” and “promotionally driven” – this speaks to pressure on margins and thus profitability.
The market liked it, with the share price closing 8.7% higher in response to the announcement.
Nibbles:
- Director dealings:
- A prescribed officer of ADvTECH (JSE: ADH) sold shares worth R1.2 million.
- An associate of the CEO of Grand Parade Investments (JSE: GPI) bought shares worth R115k.
- Tharisa (JSE: THA) has signed a new debt facility with Absa and Standard Bank that will help support its transition to underground mining. This is a four-year loan of $80 million (with an accordion of $20 million – just a fancy way of saying that there’s scope to increase it), as well as a revolving facility of $50 million (best thought of like an access bond for your house). The group also confirmed that the net cash position as at September 2025 was $68.6 million.
- When you see unusual names pop up on a shareholder register with a holding of 5%, 10% or more (as increments of 5% must be announced), sometimes it’s something and sometimes it’s nothing. At Sephaku Holdings (JSE: SEP), they announced that David Fraser and concert parties now hold 10.02% in the company. If I Google the name, the top result is for the chairman of Peregrine Capital. I cannot be 100% sure if it’s the same David Fraser, but it seems very likely.
- Universal Partners (JSE: UPL) released results for the quarter ended September 2025. Their NAV per share fell by 8.6% over 12 months. It was ever so slightly down over the past 3 months. There’s practically no liquidity in the stock, so I’m not going into details here. If you do fancy reading about one of the most diversified (and random) portfolios around – from dentistry roll-ups to credit lending – then go check them out.